The Inverted AI Adoption Map
Stanford's AI Index published Chapter 9 on public opinion for 2026. I read it next to last year's Chapter 8 and the trajectory is sharper than either report alone. The headline most outlets picked up — "optimism about AI is rising" — is technically true and badly misleading. What's actually happening is more interesting: the map of AI enthusiasm has almost no overlap with the map of AI capability, and the gap is widening.
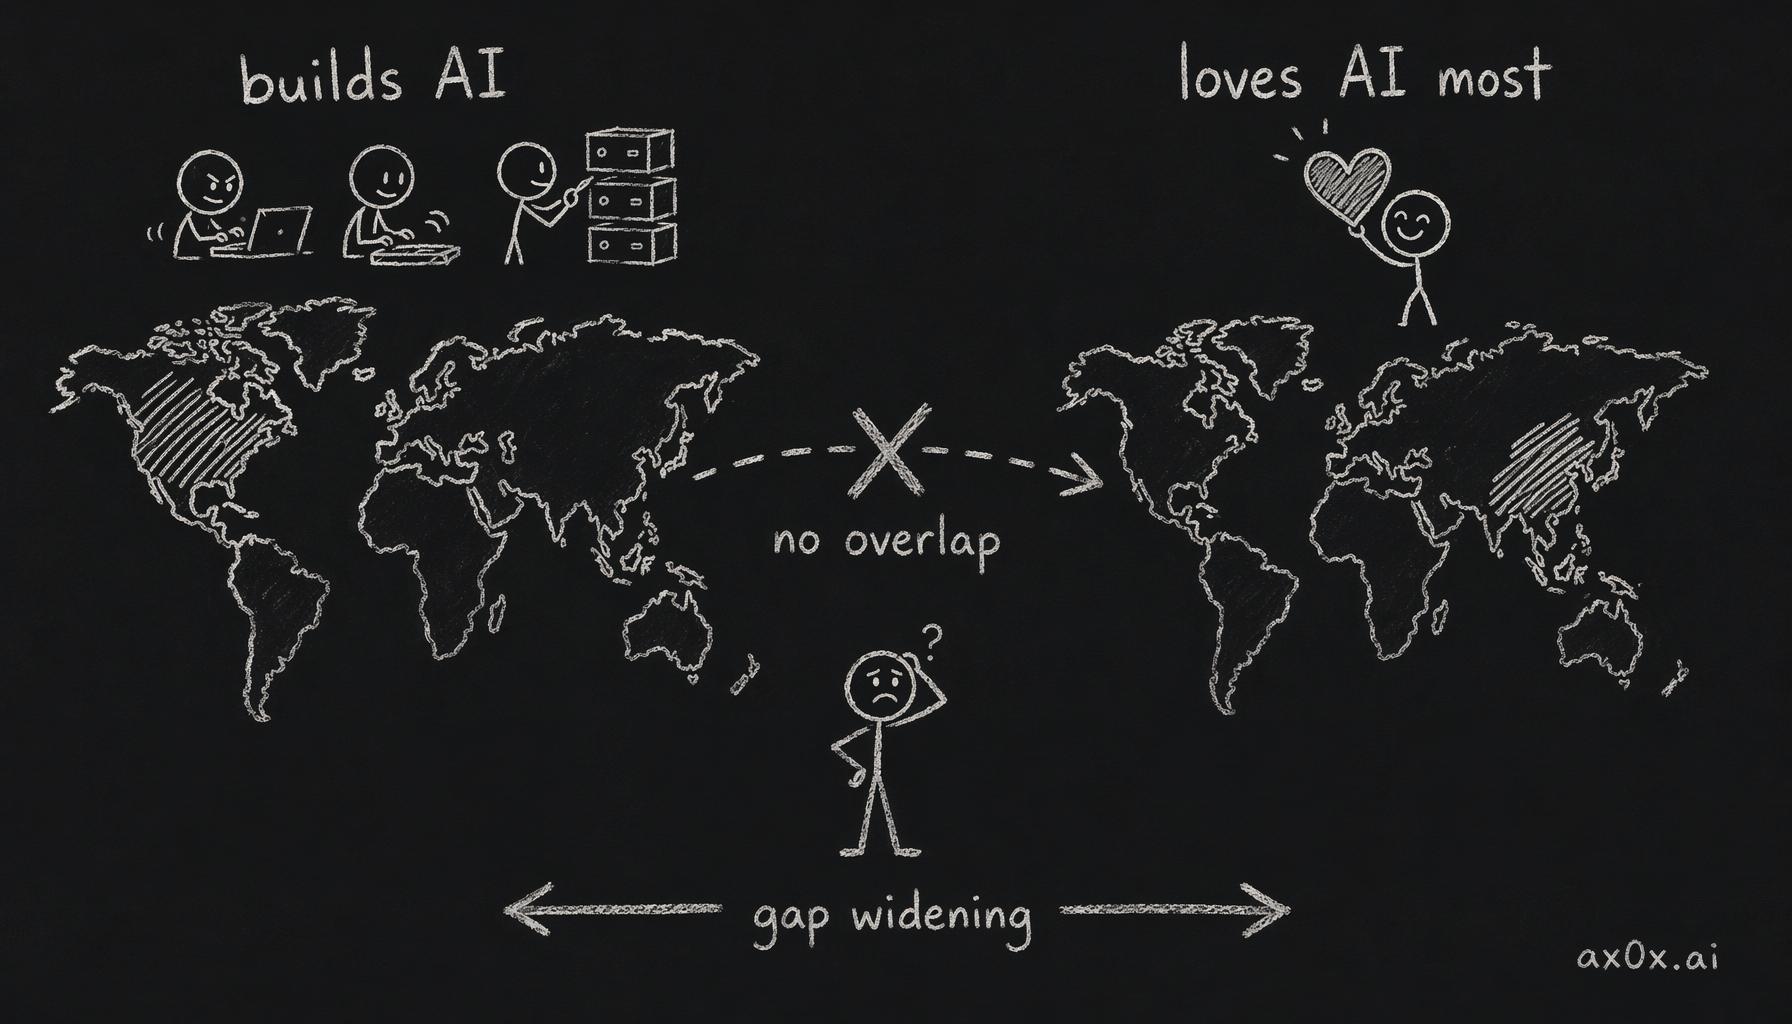 The countries that build AI and the countries most enthusiastic about it barely overlap — the capability map and the sentiment map don't line up
The data below is from two surveys. Ipsos AI Monitor, 30 countries, 23,216 adults, fielded March–April 2025. And the University of Melbourne / KPMG Global AI Survey, 47 countries, 48,340 respondents, also 2025. Both are longitudinal and well-funded. I'm not going to walk through the methodology; if you want that, the reports are free. I want to pull out the five patterns that actually matter if you build AI products or think about where adoption is heading.
1. The country that makes the most AI trusts it the least
The United States, in 2024, ranked among the most pessimistic countries on Earth about whether AI products and services produce more benefits than drawbacks. 39% agreed. That put the US below Germany (47%), France (41%), Japan (~40%), tied with Belgium, and just above the Netherlands (36%).
For comparison: China 83%, Indonesia 80%, Thailand 77%, Mexico 70%, India 62% (and falling, more on that). The people living in the country that produces the frontier models, employs the researchers, runs the training clusters, and writes the discourse about AI — those people think AI is net-negative at roughly half the rate of someone in Jakarta or Bangkok.
Trust in AI companies to protect personal data, same survey, same year: US 33%. China 66%. India 66%. Thailand 68%. The gap is exactly 2x. You can argue about what "trust" means when reported through a Chinese survey apparatus — fair — but even if you discount those numbers substantially, the US still ends up near the bottom globally, below every Western European country except the Netherlands.
The 2026 data sharpens this further. Trust in one's own government to regulate AI: Singapore 81%, Indonesia 76%, Malaysia 73%, Thailand 70%. Global median 54%. United States 31% — the lowest of any of the 30 countries surveyed. Lower than Japan (32%), lower than Hungary (33%), lower than every European country. The most powerful AI-developing nation is the least trusted by its own citizens to govern the technology it's producing.
2. The workplace numbers are not the numbers you see on LinkedIn
58% of employees globally said they use AI at work on a regular or semi-regular basis in 2025. That's the headline. The distribution behind that average is where the story is.
Over 80% regular workplace AI use: India, China, Nigeria, the UAE, Egypt, Saudi Arabia. The United States sits around 55–60%. Germany is ~35%. Most of Western Europe runs 40–50%. The Czech Republic, Greece, and Germany occupy the bottom-left of the scatter on both usage and trust.
India's organizational support for AI — measured across strategy, AI literacy, and responsible AI governance — runs 85–90% on all three dimensions. Portugal scores ~30%. That's a 55-point institutional gap, and it's not explained by technology access. India has less GPU capacity than Portugal does per capita. The difference is that Indian companies have mandated AI adoption as a corporate strategy, while Portuguese companies mostly haven't.
This matters because it flips a common assumption. The intuition — probably wrong — is that emerging markets adopt AI more slowly because of infrastructure gaps. The data says the opposite: where corporate mandates push AI into workflows, individual workers use it heavily. Where companies are cautious, workers are cautious. Infrastructure is downstream of mandate, not the gating factor.
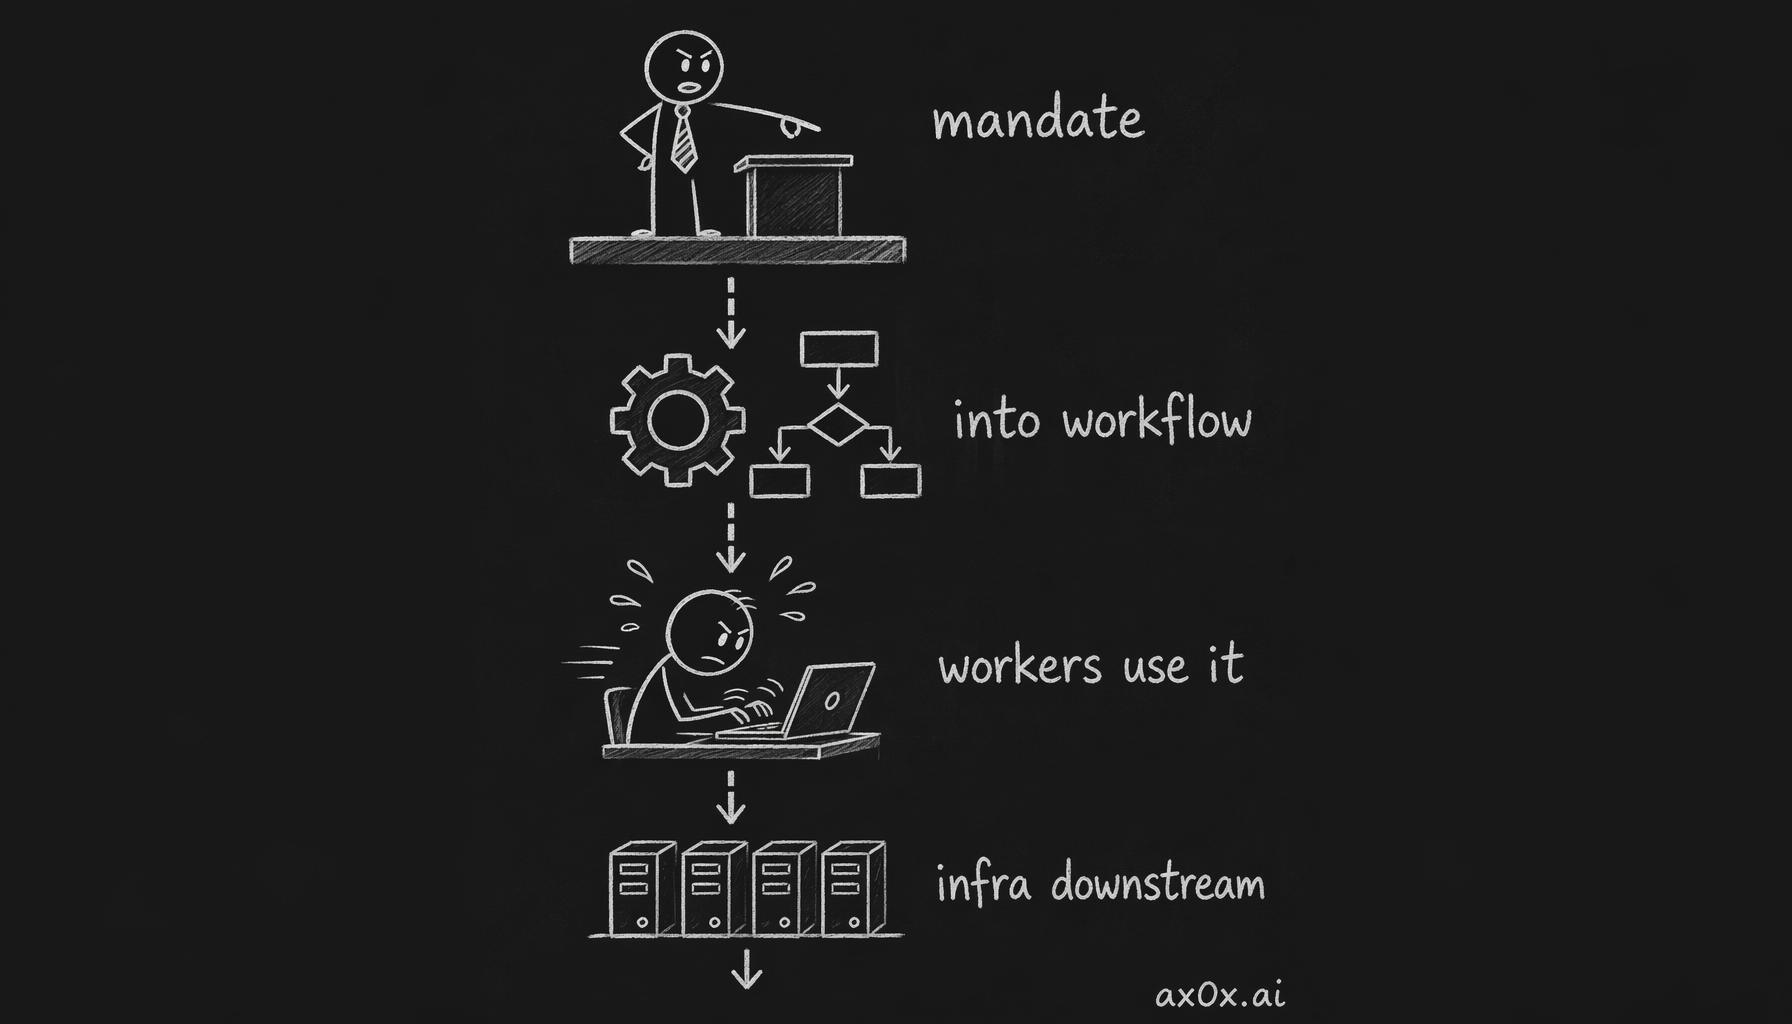 The mechanism of workplace AI adoption: top-down corporate mandate pushes AI into workflows, then workers use it heavily — infrastructure is downstream, not the gate
The 2025 chapter noted this explicitly. At the country level, AI adoption correlates with GDP per capita (richer countries have more AI infrastructure). At the individual-within-country level, the correlation inverts: workers in poorer countries who have AI access use it far more intensively than workers in richer countries who also have access. The resolution is probably that emerging-market AI users skew urban, educated, and professional, while developed-market users include a much broader cross-section of workers — many of whom are skeptical, underexposed, or protected by institutional caution.
If you're building AI workflow products in San Francisco and your customer research pool is Bay Area knowledge workers, your users are a statistically extreme outlier on both enthusiasm and exposure compared to the global 58%.
3. Optimism and anxiety are both rising — that's not a contradiction
The 2026 report's cleanest finding: globally, "AI has more benefits than drawbacks" rose from 55% to 59% year-over-year. In the same population, "AI products make me nervous" rose from 50% to 52%. The two numbers moved in the same direction at roughly the same rate.
If you treat optimism and anxiety as a single axis, this looks incoherent. It's not. These are two different questions about the same technology: do I expect this to be useful to me personally (optimism) and do I think this might go badly at scale (anxiety). A worker who just automated 40% of their spreadsheet work with a chatbot can sincerely answer yes to both. The population is getting smarter about AI, not more polarized — they're holding two true beliefs simultaneously.
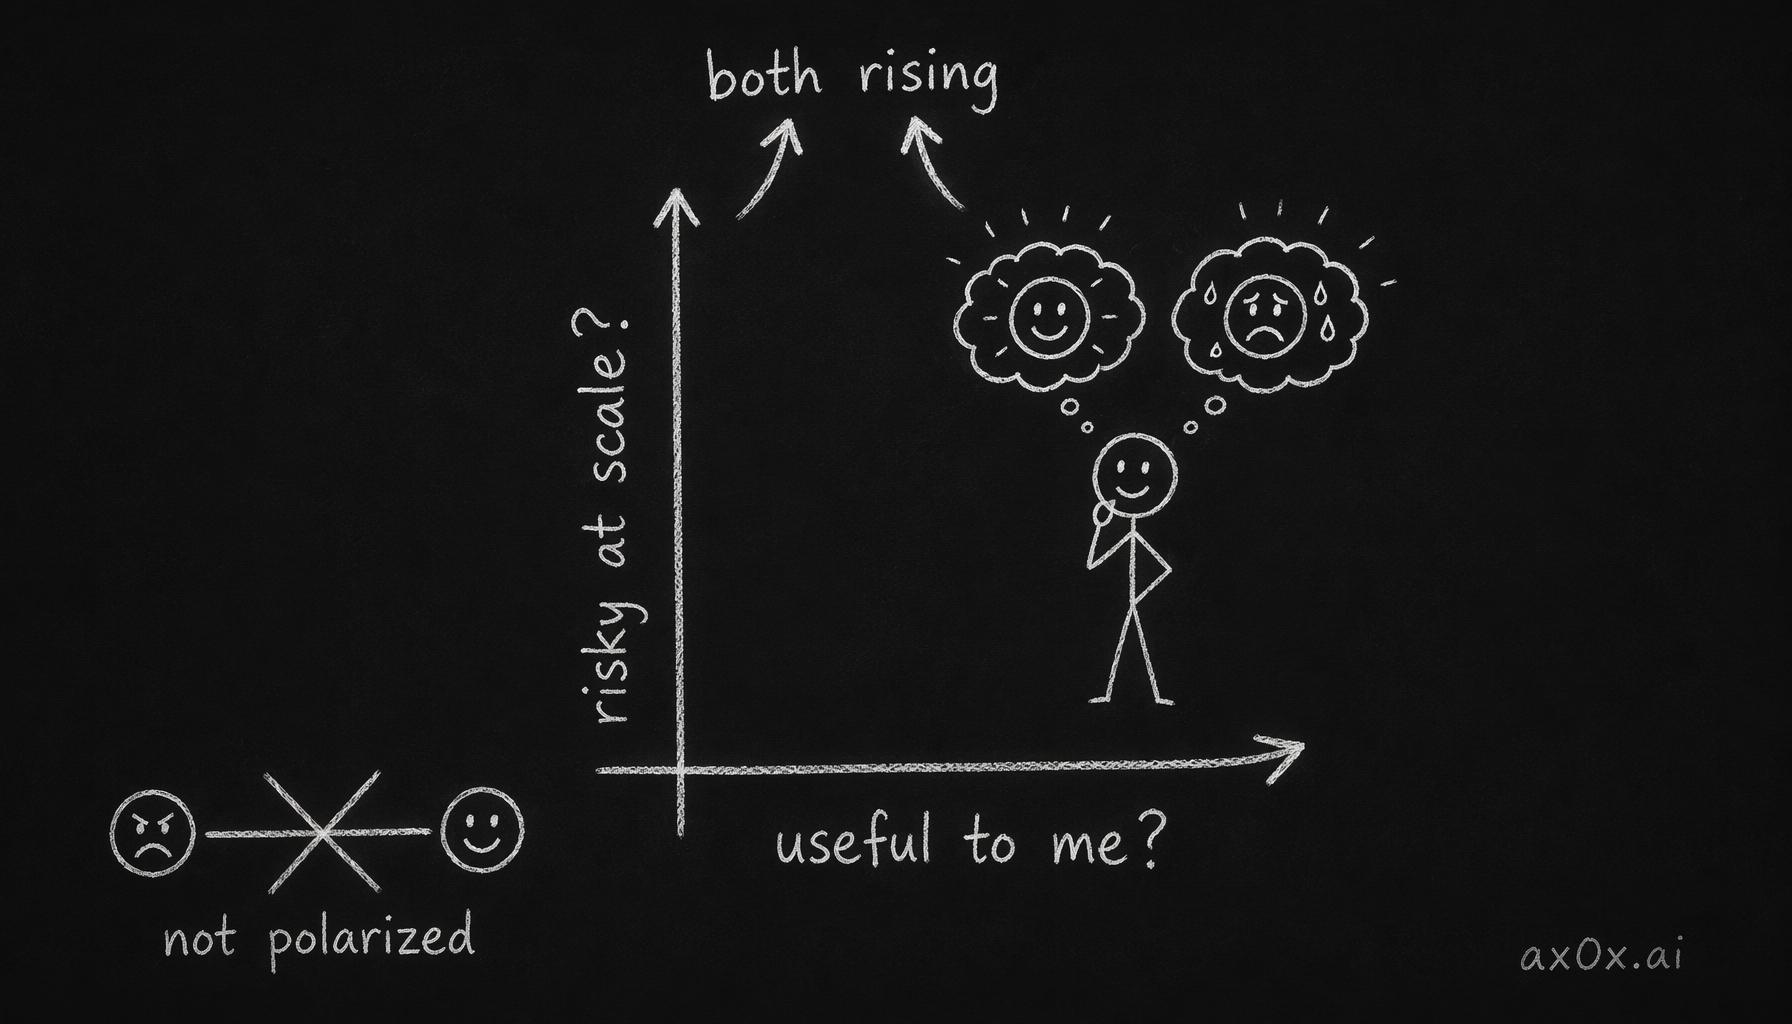 Optimism and anxiety are two separate axes, not the ends of one line — 'useful to me?' and 'risky at scale?' can both be true and both rise together
Country-level nervousness changes, 2022–2024: Sweden +19 points (the largest jump in the data). United States +12 points. Most Anglosphere countries rose 8–12 points. India's nervousness rose +14 points in the most recent year alone, while excitement in India rose only +2 — the sharpest anxiety-excitement divergence in the full dataset. India is the country with the fastest-growing workplace AI use and, simultaneously, the fastest-growing anxiety about it. Those two things are not in tension. They are the same signal, which is: India's workers are interacting with this technology more, and the interaction is producing more complex feelings than "hype" or "fear" alone.
Japan is the only country that moves differently. Low excitement (~46%), low nervousness (~25%), stable across years. Not skeptical — disengaged. When people stop having strong feelings about a technology, that's either because they're too far from it (Japan's AI adoption is mid-pack) or too adapted to it to notice. For Japan, it reads like the former.
4. The expert-public gap, inside the US, is 50 points
Pew Research surveyed 5,410 US adults and 1,013 AI experts in parallel. Both groups got the same questions about the next 20 years.
- Will AI positively impact how people do their jobs? Experts: 73%. Public: 23%. Gap: 50 points.
- Positive impact on the economy? Experts: 69%. Public: 21%. Gap: 48 points.
- Positive impact on medical care? Experts 84%, public 44%. Gap 40 points.
- Positive impact on K-12 education? Experts 61%, public 24%. Gap 37 points.
These aren't small methodological artifacts. They are the largest expert-public divergences on any technology question I've seen in recent survey data. The people who build AI and the people who use AI are not watching the same movie. This is worth staring at for a minute. It's not that the public is uninformed and the experts are right — experts are optimistic across every dimension while being fully aware of the risks their own research papers flag. The public is pessimistic across every dimension while being demonstrably heavy users of the products. Both groups are acting rationally on information the other group doesn't fully weight.
On jobs specifically: 64% of US adults expect AI will lead to fewer jobs in the next 20 years. 5% expect more. Even among AI experts, only 19% predict more jobs; 39% predict fewer. The labor-market pessimism is genuinely widespread. The expert disagreement with the public is not "AI will create jobs" — it's "AI will create some jobs while destroying others, and the net is less clear than you think." That's a much narrower disagreement than the headline gap suggests.
The practical implication for anyone building an AI product in the US: your user base skews heavily toward people who think the product category is a net negative for their livelihood. They use it anyway because it's useful to them personally. This is not a stable equilibrium. It's the same psychological profile that drove the 2010s backlash against social media — private utility, public resentment, eventual regulation.
5. The "previously skeptical countries are warming up" story is a catch-up, not a convergence
The headline in the Western press — Germany is getting excited about AI — is real. Germany rose +12 points on "more benefits than drawbacks" from 2022 to 2025, the biggest gain in Europe. France +10, Netherlands +10, UK +5, US +7. These are meaningful shifts in longitudinal survey data where movements of 1–2 points are normal.
But Germany's absolute number is still 47%. China's is 83%. The gap between the most optimistic and most skeptical major economies was 44 points in 2022 and roughly 36 points in 2025. It narrowed. It did not close. And on the anxiety axis, Germany and the US are still in the "high nervous / low excited" quadrant of the Ipsos scatter. The trend line is up; the baseline was very low; the destination is still a long way off from global enthusiasm norms.
The reports frame this as "AI optimism rising among previously skeptical countries." A more honest framing: the floor is coming up. The ceiling — in China, Thailand, Indonesia, India — is either stable or, in India's case, actively coming down. Convergence would require both ends to move toward each other. Only the low end is moving.
6. What this means if you build AI products
I run a company that sells GPU infrastructure to people building AI, and I've shipped six consumer AI products in the last two months as side projects. So I think about who actually uses this stuff constantly. Three concrete updates to my mental model after sitting with this data:
The global AI product market has a very different center of gravity than the AI research market. The research center is US → UK → EU → China. The user enthusiasm center is China → Southeast Asia → MENA → Latin America → then South Asia (with India as a complicated case). If you're a US-based builder and you optimize your product for your own intuitions about user sentiment, you are calibrating to the global 10th percentile of enthusiasm. Products that feel "aggressive" to an American user feel normal to an Indonesian one.
Institutional mandate beats individual curiosity for workplace adoption. India didn't become an 80%-at-work country through bottom-up adoption. It became one because Indian companies put AI in workflows, trained staff, and made it a measured objective. If you sell workplace AI, the most important variable in your expansion pipeline isn't the individual persuasion argument — it's whether you can get a mandate from the buyer. The gap between persuasion-driven markets (US SMB) and mandate-driven markets (Indian enterprise) isn't 20% usage differential; it's a multiple.
Trust in builders is structurally lower than trust in the product. Americans are heavy AI users and they still distrust the companies making the AI by a 2x margin versus their Chinese counterparts. That gap doesn't close by shipping better features. It closes (if at all) by the industry producing a visible alternative to the current set of AI companies — different governance, different data practices, different public accountability. Nobody is incentivized to produce that alternative right now, which is why the trust deficit will probably widen before it narrows. The people who notice this first and build products that actively address it will have an unusual position five years from now.
The simplest version of the story: the world is becoming more enthusiastic about AI and the US is becoming more enthusiastic about AI, but these are different sentences. The world's enthusiasm is concentrated in countries where most builders don't live, aren't marketing, and aren't getting feedback from. The US's enthusiasm is rising from a very skeptical base, and the skepticism is rising on top of it at almost the same rate. If you were going to bet on which version of "AI sentiment" dominates the next three years of product strategy, the one that's actually growing is not the one most builders are looking at.
The inverted map isn't a temporary anomaly. It's the default.