
When the Power Blinks
Backup power in a data center works like a relay race. When the grid drops, the first runner off the blocks is a bank of capacitors that responds in microseconds and holds a few milliseconds of energy. A battery takes the baton and carries minutes. A generator takes it after that and can run for as long as there is fuel. Each runner closer to the chip is faster and carries less. Each runner further away is slower and carries more.
What I took from Kian's course is that the runners are rarely the whole story. In the failures the course walks through, the trouble usually sits at the handoffs: a bus that every "redundant" module shares, a breaker that fails to open, a control panel nobody put on protected power, a database that lived in one building. This part walks the relay leg by leg, then looks at where the baton actually gets dropped.
The last part followed the voltage down from 345 kV to about one volt at the die. This one asks what happens when the top of that staircase disappears for a moment.
Why the UPS converts power twice on purpose
A facility UPS (uninterruptible power supply) looks pointless from the outside. AC goes in, AC comes out, and in between it converts the power twice. A rectifier turns the incoming AC into DC, that DC sits on an internal bus called the DC link, and an inverter turns it back into AC for the load. Why pay the conversion losses?
Because the battery is wired to the DC link. In normal operation the rectifier keeps the link charged and the inverter draws from it. When the utility fails, the battery simply starts feeding the same link, and the inverter never notices that its source changed. There is no switch to flip, so there is no gap. Vendors quote a transfer time of zero milliseconds for this design, which is called online or double conversion.
The cheaper alternative, an offline or standby UPS, feeds the load straight from the utility and flips a transfer switch over to battery when the power fails. That flip takes a few milliseconds. The facility UPSs in most data centers are online designs, so there is no flip to wait for. Many run in eco or energy-saver modes that reach about 99% efficiency, and the largest operators have been pushing batteries down into the rack itself, which we'll get to.
Besides the rectifier, DC link and inverter, a facility UPS has a battery interface (the batteries live in separate cabinets) and a static bypass. It sits in gray space, the electrical rooms next to the IT hall, not on the white-space floor with the racks. Kian uses Schneider Electric's Easy UPS 3-Phase Modular as his example: 50 to 250 kW per cabinet, built from 50 kW power modules, each cabinet about 2 m tall, 0.6 m wide and 0.85 m deep. Four of them in parallel give 1 MW. Run them as 750 kW of usable capacity with one cabinet held as a spare and you have your first taste of redundancy notation: N+1.
The relay, from generator to capacitor
Start at the slow end. A standby generator has to start, come up to speed and synchronize before it can take load. The common data-center spec, NFPA 110 Type 10, requires power back on the emergency loads within about 10 seconds. Large plants with many generators running in parallel add synchronization and transfer time on top, so the full handoff can stretch to tens of seconds. That is still seconds, not minutes.
So why are UPS batteries sized for five to ten minutes? Because generators sometimes fail to start, and someone has to have time to deal with that. Intel designed one of its data centers around five minutes of UPS at full load. The Portland facility in the Cloudflare story below had batteries rated for about ten. The minutes are margin for a bad day.
Battery sizing has two limits. Kian's example: a 1 MWh battery bank on paper, but only 80% of that sits in the usable charge window, and the conversion path is about 95% efficient. That leaves 1 × 0.8 × 0.95 = 0.76 MWh you can actually deliver. Against a 6 MW load, that lasts 7.6 minutes. Now suppose the same bank can only push 4 MW out. It cannot carry 6 MW at all, no matter how much energy is stored. Energy decides how long the battery lasts, power decides whether it can carry the load at all, and you have to size for both.
Below the battery sit the capacitors. A capacitor stores charge in proportion to its voltage; a 0.2 F capacitor at 800 V holds 160 coulombs. The energy it stores is half of capacitance times voltage squared, ½ × 0.2 × 800², which is 64 kJ. That sounds like a lot until you ask how much of it you can use. The equipment downstream stops working if the bus falls below, say, 700 V. Between 800 V and 700 V the capacitor gives up only 15 kJ, which covers 1 MW for 15 milliseconds. The other 49 kJ stays stranded inside, because draining the bus below 700 V is pointless.
Fifteen milliseconds is tiny, and that is the point: the capacitor only fills the gap while the next runner gets up to speed. Kian's more realistic version assumes, as a teaching device, that the battery ramps linearly from zero to 1 MW over 10 ms. The capacitor only has to cover the triangle-shaped shortfall during that ramp, ½ × 1 MW × 10 ms = 5 kJ. Run that back through the energy formula and the bus sags from 800 V to about 768 V and holds there, well above the 700 V floor.
Then the capacitor has to be refilled, which needs power above what the load is drawing: with 50 kW of surplus, putting 5 kJ back takes 100 ms. Until then, the first runner isn't ready for the next stumble.
For scale, 0.2 F at 800 V is a classroom size. NVIDIA's GB300 power shelves hold about 65 J of capacitor energy per GPU, roughly 4.7 kJ across a 72-GPU rack. Keep that 4.7 kJ in mind; it comes back in the next section.
The relay doesn't stop at the facility UPS. Inside the rack, the power supplies (PSUs) turn AC into DC for the last time, and battery backup units (BBUs) sit on the rack's DC bus. Under the Open Rack v3 spec, a BBU module has to take over the busbar within about 2 ms and supply 3 kW for four minutes. Delta makes 3 kW, 48 V BBU modules in the same form factor as the PSUs, so a shelf takes either; six of them make 18 kW, or 15 kW usable with one spare. On the board, the voltage regulators that ring the GPU have their own capacitors covering transients far shorter than a millisecond (the VRMs were the previous part's last inch). So the full ladder runs grid and generator, then the facility UPS, then rack PSUs with BBUs, then VRM capacitors.
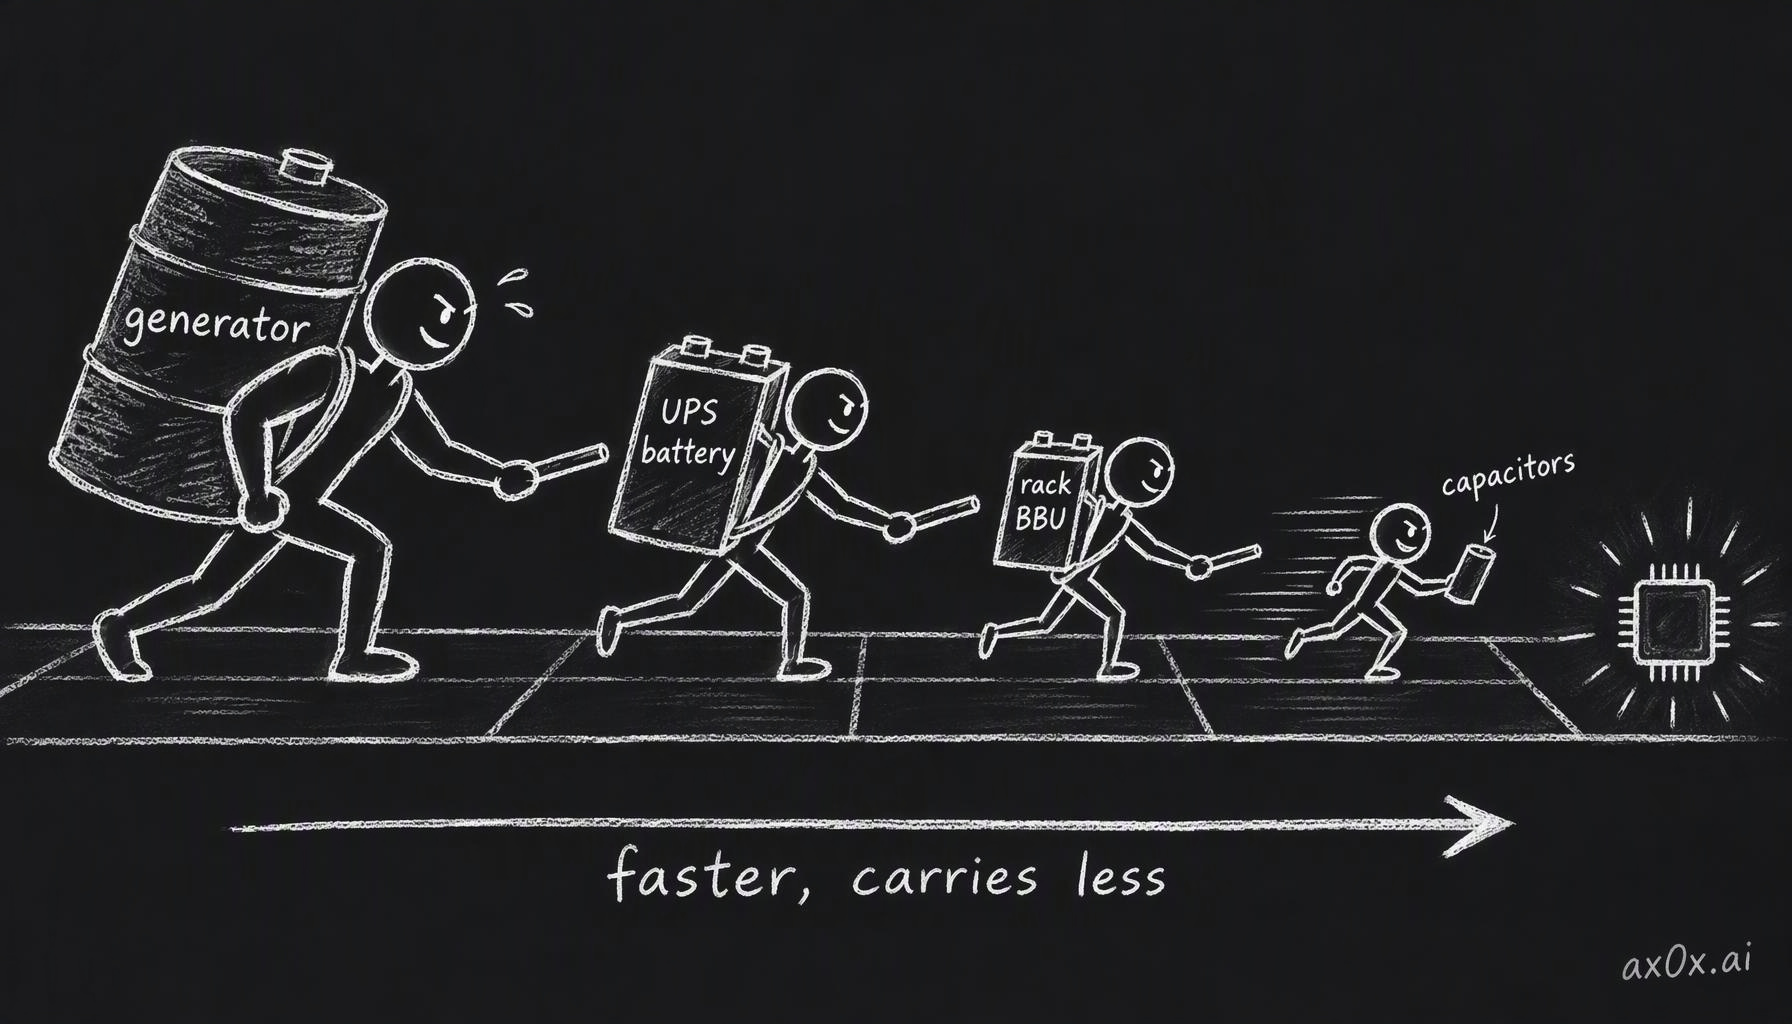 Backup power is a relay: the generator carries hours but takes seconds to start, the UPS battery carries minutes, the rack BBU takes over within milliseconds, and capacitors respond fastest but hold only milliseconds of energy
Training makes the power blink from the inside
So far the threat has come from outside. AI training adds one from inside the building, and it is one reason buffers keep moving into the rack.
In synchronous training, thousands of GPUs compute on their slice of the data, then stop and exchange gradients with each other before the next step. During the compute phase they draw close to their maximum power. During the exchange they draw close to idle. And they do it together, in lockstep. In part two we looked at how the model shapes memory and bandwidth; this is how it shapes the power trace.
The evidence Kian uses is a 2025 paper from Microsoft, OpenAI and NVIDIA, "Power Stabilization for AI Training Datacenters". Its first figure shows power readings from a production training job on DGX H100 racks over about 200 seconds, a little over three minutes, and the line is a sawtooth: repeated deep drops and sharp climbs. At full scale the paper says those swings reach tens or hundreds of megawatts, at frequencies that could excite resonances in turbine-generators or transmission lines. Meta reported the same thing in its Llama 3 paper: when tens of thousands of GPUs pause together, for checkpoints, collective communication, or a job starting or stopping, data-center power can swing by tens of megawatts almost instantly.
Kian's worked example makes it concrete. Picture one unit of work that draws 120 kW while computing, 40 kW while exchanging and 60 kW while saving weights, averaging 85 kW over a cycle. (At 120 kW that unit is a rack or a group of racks; a single H100 is closer to 0.7 kW.) Run four of them in lockstep and the peak is 480 kW while the average is only 340 kW. If they were four independent jobs started 15 seconds apart, the phases would interleave and the draw would flatten to about 340 kW with the same total energy. That is idealized, since one synchronous job can't be staggered against itself, but it shows why the course's rule for this chapter is to size supply from the workload's measured power trace (its peak, its energy and how fast it changes), not from its average.
The Microsoft paper lists three fixes. Software can run a secondary workload, useful or dummy, during the communication dips to fill them in. GPU firmware can enforce a power floor and limit how fast power ramps. And energy storage at the rack can absorb what's left, with fast telemetry as a backstop. NVIDIA built the hardware side into GB300 NVL72: programmable power caps and ramp limits, those electrolytic capacitors that take up about half the PSU volume, and a "power burner" that softens the drop when the GPUs go quiet. NVIDIA measured up to 30% lower peak grid demand than GB200 on a Megatron training run.
Here is where the rack BBU earns its slot. Suppose an ML job suddenly raises a rack's load by 40 kW, and the PSUs need 0.2 s to ramp up to it. The shortfall is a triangle again: ½ × 40 kW × 0.2 s = 4 kJ, which the BBU supplies. If the PSUs ramp half as fast, over 0.4 s, the gap doubles to 8 kJ. When the GPUs pause to sync, the same swing runs in reverse: the rack has roughly 4 kJ of surplus to soak up, or the DC bus voltage rises. That 4 kJ is close to the 4.7 kJ of capacitor energy NVIDIA put in each GB300 rack, so the course's toy triangle and the shipping product are at least the same order of size.
There is a catch on the refill. A real ORv3 BBU discharges at 3 kW but charges at only about 250 W, so it takes far longer to fill than to empty. If the swings arrive back to back faster than the battery can recover, it drains a little with each one and is not there when it's needed.
Redundancy is counted along the path
Redundancy notation starts simple. Take a 100 kW load and UPS modules of 50 kW each. Two modules give you exactly what you need, which is called N: no redundancy, and one failure drops the load. A third module makes it N+1: you can take one out for maintenance or lose one to a fault, but not both at once. A fourth makes it N+2, which survives a module in maintenance plus another failing.
Four modules is also the module count 2N would give you here, and that coincidence trips people up. The counts only match because N happens to be 2; the two terms mean different things. 2N is structural: two fully independent paths, A and B, each able to carry the whole load alone, with every server plugged into both through two power cords. You can isolate all of path A and run on B. 2N+1 adds a spare module to each path, so with 150 kW per side for a 100 kW load you can lose a module on B while A is down for maintenance. Kian treats 2N+1 as about the practical ceiling; beyond it, he argues, only strange combinations of events cause outages and the extra cost buys little.
The trap is the shared bus. Put three modules in N+1 and wire them all into one output bus, and that bus is a single point of failure. A fault on it takes everything down, however many spare modules sit behind it. Module redundancy only protects you if the paths after the modules are independent too. Uptime Institute, the body that certifies data-center tiers, says the same thing from its side: counting N+1 or 2N components does not by itself earn a tier.
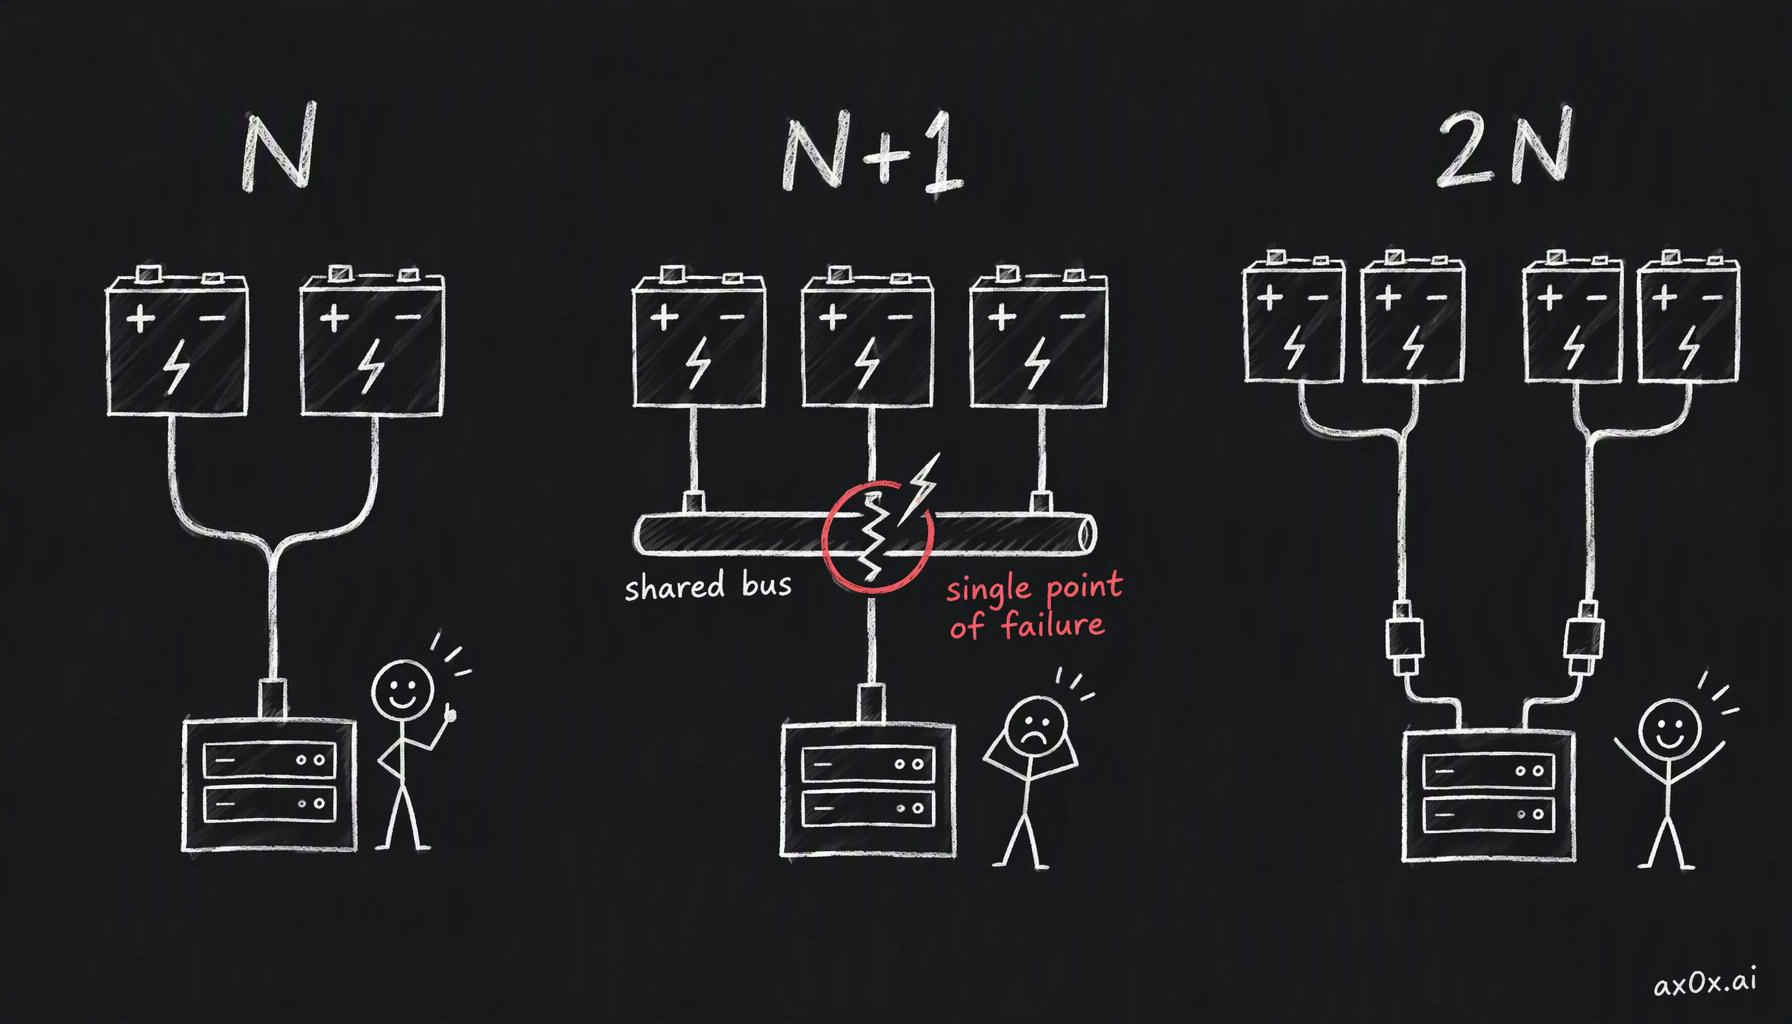 N, N+1 and 2N count spare modules, but if every module feeds one shared output bus, that bus is a single point of failure no matter how many spares sit behind it
Redundancy also erodes quietly. If the load on those three 50 kW modules grows from 100 kW to 150 kW, N+1 has become N without anyone touching the electrical room. Kian's point is that spare capacity is also what lets an operator drop in a hungrier GPU generation without rebuilding the power plant, so in AI halls, where each generation draws more per rack, an upgrade can quietly spend the fault tolerance.
Faults travel upward. Several halls hang off one upstream supply. If Hall A faults and its breaker opens, only Hall A goes dark. If Hall A's breaker receives the trip signal and stays closed, the fault keeps feeding from the shared bus until the next breaker upstream opens, and that one de-energizes Hall B along with it, though nothing was wrong in Hall B. Engineers call the discipline of making the nearest breaker open first selective coordination, with backup for the breaker that fails. The general lesson is to find where the paths converge in the distribution tree, because that is where one failure becomes many.
Bypass modes are the other quiet single point of failure. A static bypass lets the UPS route the load around its own rectifier and inverter if one of them faults. A maintenance bypass carries the load around a fully isolated UPS so technicians can work on it. Either way, the load is now on a single source with no battery behind it. Kian's quiz makes this sharp: the inverter has failed, the load is running on static bypass from the utility, and then the utility fails. The load drops. The battery is fine, but its only path to the load runs through the dead inverter, and the load stays dark until the generator starts and transfers, which takes seconds.
His other quiz moves the dropped baton out of the electrical room. The utility fails and the generators start. The racks are on UPS and generator; the pumps and heat-rejection equipment are on generator. The cooling controls, though, were left on utility power only. The workload still stops, because without control power the cooling plant can't run and the racks overheat. Every dependency of the IT load has to be on protected power, including the small ones nobody thinks of as critical. (Part seven picks up the cooling side.)
Tiers describe the building, nines describe the year
Uptime Institute's tiers describe a design. Tier I is basic power and cooling. Tier II adds redundant components. Tier III is concurrently maintainable: you can take a path down for planned work without stopping the IT load. Tier IV is fault tolerant: it also survives an unplanned failure on one path. The gap between III and IV is the gap between planned and unplanned. In Uptime's standard, the on-site generator plant is treated as the facility's only reliable power source, so on-site generation appears at every tier and the utility is not required for any of them.
Nines describe what actually happened, or what a contract promises. Three nines, 99.9%, allows about 8 hours 46 minutes of downtime a year. Four nines allows about 52.6 minutes. Five nines, about 5.26 minutes. Kian notes that colocation SLAs on power often promise five nines. The tier-to-percentage tables that circulate online are legacy industry shorthand, not Uptime's standard; a tier says which failures the design should survive, and nines say how the year went.
Kian mentions Equinix's Houston data center, which stayed fully online through Hurricane Harvey in 2017. The microgrid Redwood Materials built in Sparks, Nevada, launched in June 2025 with 12 MW of solar and 63 MWh of second-life EV batteries feeding Crusoe Spark modular data centers, reports 99.2% operational uptime on its own; Crusoe says the service holds 99.9% only by using the grid as backup.
The most interesting case is a site that removed runners on purpose. In a blog post on 12 November 2025, Microsoft's Scott Guthrie wrote that its Fairwater site in Atlanta achieves four nines of availability at three-nines cost, and that for its GPU fleet it forgoes on-site generation, UPS systems and dual-corded distribution. Atlanta was chosen for resilient utility power. In relay terms, Microsoft took out its own runners and let the utility run the whole race; it bought its reliability from a very reliable grid connection instead of building it on site. Microsoft hasn't published how the grid connection delivers that, and four nines is a design claim, not measured uptime. The same post separately lists the training-swing dampers from the previous section (filler workloads, GPU-enforced power thresholds, on-site storage); they aren't presented as what lets the site skip the UPS. Part three covered how hard a grid connection is to get in the first place.
Where the baton actually drops
The clearest case in the course is Cloudflare. On 2 November 2023, Flexential's facility in Portland, one of three sites behind Cloudflare's control plane, lost power. The two other sites stayed up and were useless, because Kafka and ClickHouse, two services the control plane depended on, lived only in the site that went dark. Most of the control plane was back at the disaster-recovery site by 17:57 UTC the same day; Cloudflare closed the incident on 4 November at 04:25 UTC, about 40 hours after it began.
Cloudflare's post-mortem shows how tightly the failures were linked. The same ground fault that cut the utility also tripped all ten generators that were supposed to replace it. The UPS batteries, meant to last about ten minutes, started failing after about four, so the window for restarting the generators by hand was short. The site's access-control system was not on battery, and the night shift was security staff plus a technician one week into the job. The access-control detail is Kian's cooling-controls quiz with real names attached.
Afterwards Cloudflare declared "Code Orange": it removed single-site dependencies, added capacity and started testing what happens when a whole facility is lost. On 26 March 2024 the same Portland facility lost power again at 14:58 UTC, this time reportedly because four Flexential switchboards serving all of Cloudflare's cages failed at once. APIs and dashboard were back by 15:05 UTC with no humans involved, and analytics recovered later that day. Kian's comment on the first outage is that it looks obvious in hindsight, but a data center may have something like a thousand potential single points of failure, and fixing 999 of them is not enough.
The other half of the lesson is that at AI scale you cannot design the failures away, so you design the recovery in. Meta's Llama 3 paper reports that over a 54-day stretch of pre-training on 16,384 H100s, the job saw 466 interruptions: 47 planned and 419 unexpected, about one unexpected failure every three hours, around 78% of them hardware-related. Effective training time still stayed above 90%, and only three interruptions needed significant manual work. Meta also maintains its clusters in what it calls maintenance trains, taking one maintenance domain down at a time so the rest of the fleet keeps working. For a job spread across thousands of GPUs, checkpointing and automatic restart belong in the design from day one.
If you train or fine-tune on rented clusters, a long job that occasionally dies and resumes from its last checkpoint, even in a facility advertised as fully redundant, is probably this design doing its job: at that scale something fails every few hours, and in Meta's count most of those failures were hardware. And when a provider's status page reports an outage at a site with generators, batteries and a redundancy rating, I'd look first at the places where the baton changes hands: a shared bus, a breaker, a service that lived in one building.
Power isn't the only thing that has to stay synchronized across ten thousand GPUs. Next: how they talk to each other.
This series is compiled from Kian's (@neuralkian) freeCodeCamp course "Inside an AI Factory – Power, Cooling, and GPUs Explained" (originally titled From Watts to Tokens; course notes at kiankyars.github.io/gigawatt). The framework and most examples are Kian's; I reorganized it by theme and re-checked the numbers, so any errors are mine. Companies are named only as examples, and nothing here is investment advice.