What Is a Stock, Really — First Principles
Chapter 3 of 10 in the AI-Native Investor curriculum.
The S&P 500 has returned roughly 10% per year over the past century. That number gets quoted so often that it has become furniture — present in every room, noticed by nobody. But the 10% is not one thing. It is three things added together, and the mix changes by decade. From 1980 to 2000, multiple expansion — investors paying higher prices for the same dollar of earnings — contributed more than half the return. From 2000 to 2010, it contributed negative return. Same index. Same companies, more or less. Completely different decomposition.
If you cannot break a return into its components, you cannot judge where future returns will come from. And if you cannot judge that, you will accept whatever narrative an agent hands you — because the agent's narrative will sound coherent, cite real numbers, and arrive in under a minute.
This chapter gives you the vocabulary to decompose returns, the mental model to understand why markets are hard to beat, and a taxonomy of edge types so you can be honest about which ones are available to you. All of this is prerequisite to Chapters 4 through 7 — without it, the financial statement reading, valuation, risk, and thesis chapters are procedures without understanding.
Table of contents
- What you are actually buying
- Three sources of return
- Why markets are hard to beat — and what that does and does not mean
- Five types of edge
- Where agents fit — and where they do not
- Workshop: decompose a return, argue with it
1. What you are actually buying
When you buy a share of a company, the transaction feels like buying a thing. You go to a brokerage, you pay a price, you receive a share. The share sits in your account with a ticker symbol and a number that moves every second. It feels like you bought a ticket — a ticket whose price fluctuates based on whether other people want it.
That feeling is wrong, and the wrongness matters.
What you bought is a fractional claim on the future cash flows of a business. Not the business itself — you cannot walk into the office and rearrange the furniture. Not the current earnings — those belong to this quarter's operations. What you own is a proportional right to whatever cash the business generates from now until the end of its existence, minus whatever it reinvests, pays in taxes, and services in debt.
Benjamin Graham put it this way in 1949: "An investment operation is one which, upon thorough analysis, promises safety of principal and an adequate return." The definition is useful because of what it excludes. It excludes hoping the price goes up because someone else will pay more. It excludes buying because the chart looks good. It excludes buying because an agent told you the company is "well-positioned for growth." All of those might correlate with good outcomes, but none of them are the thing you are buying.
This distinction sounds academic. It is not. It is the single most consequential mental model in investing, because it determines what questions you ask.
If you think you are buying a ticker, your questions are about price: will it go up? When? By how much? These are prediction questions, and nobody — no human, no agent, no model — answers them reliably.
If you think you are buying a claim on future cash flows, your questions change entirely: how much cash does this business generate? Is that amount growing or shrinking? How durable is the mechanism that produces it? What would have to go wrong for the cash flows to collapse? These are analytical questions. They have knowable answers — imprecise, contingent, but knowable. And they are exactly the kind of questions an agent can help you investigate, provided you know enough to judge the investigation.
The price you pay is not what you own
This is worth dwelling on because it is where most people's intuition breaks.
If you buy a share of Coca-Cola at $60, you did not buy $60 worth of Coca-Cola. You bought a stream of future cash flows at a price that implies certain expectations about those flows. If the cash flows turn out to exceed those expectations, your investment will do well regardless of what the price does tomorrow. If they fall short, it will do poorly regardless of what any analyst — human or artificial — says about the company's brand value.
The price is an entry point. The value is the stream. The gap between them — what Graham called the margin of safety — is the only reliable source of investment return. Everything else is speculation wearing a suit.
Warren Buffett's adaptation of this principle is practical: "Price is what you pay. Value is what you get." The sentence is simple enough to fit on a bumper sticker, and most people who quote it have never decomposed what "what you get" actually means in cash-flow terms. The decomposition is what this chapter is for.
What this means for working with agents
When you ask an agent to evaluate a stock, the agent will produce output. The question is what kind of output, and that depends on what kind of question you asked.
If you ask "is NVDA a good stock to buy?" you will get a narrative about the company's position, recent earnings, competitive advantages, and maybe a price target. This is the ticker-buying frame. The agent is answering a prediction question, and its answer will be a well-organized version of consensus opinion.
If you ask "decompose NVDA's total return over the last ten years into dividends, earnings growth, and multiple expansion — then tell me which component contributed most and whether the conditions that drove it are still present" — you are operating in the cash-flow frame. The agent's output will be more specific, more verifiable, and more useful. It will also be more likely to surface things you did not expect, because decomposition forces the agent to separate sources rather than blend them into a narrative.
The difference is not in the agent's capability. It is in the question. This is what Chapter 2 means by the tutor and analyst roles requiring different prompts. The financial vocabulary you build in this chapter is what allows you to ask the second type of question instead of the first.
2. Three sources of return
Every stock return decomposes into three components. This is not a theory or a framework invented by a guru. It is arithmetic — an identity that holds by definition.
Total return = dividend yield + earnings growth + change in valuation multiple
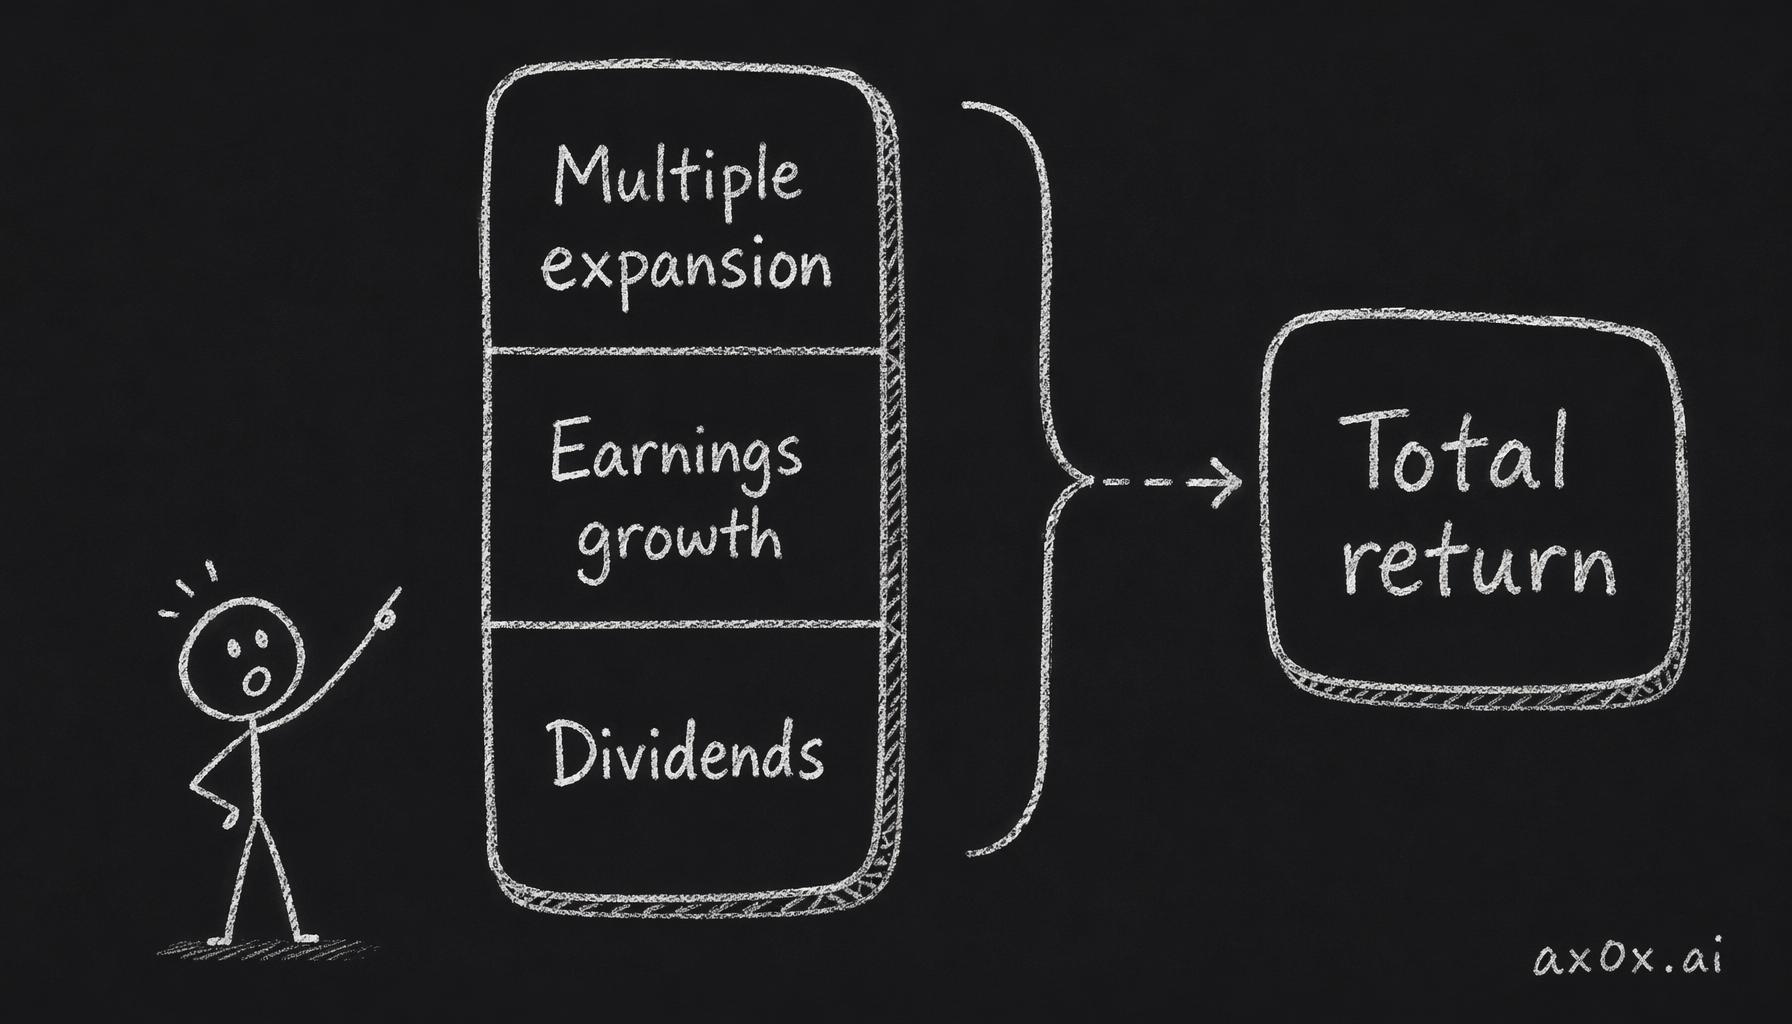 A stock's total return is only ever three things stacked together — dividends, earnings growth, and multiple expansion
If you bought a stock for $100, held it for a year, and it is now worth $115 with $3 in dividends paid, your total return is 18%. That 18% came from some combination of: the company paying you cash (dividends), the company earning more money (earnings growth that lifted the price), and other investors being willing to pay a higher multiple for the same earnings (multiple expansion).
Understanding this decomposition is not optional. It is the vocabulary you need for Chapters 4 through 7, and it is the lens through which you evaluate every agent-generated analysis from here forward.
Source 1 — Dividends: cash in hand
A dividend is the company handing you cash. It is the most boring source of return, the one that gets the least attention from financial media, and — over long periods — one of the most significant contributors to total return.
The archetype: Coca-Cola. From 1990 to 2020, Coca-Cola's stock price increased roughly 1,400%. Impressive — until you learn that with dividends reinvested, the total return was over 3,800%. The difference is the compounding effect of dividends being reinvested at each period's price. The company paid cash, you used that cash to buy more shares, those shares paid more cash. The mechanism is mechanical, not speculative.
Coca-Cola's business model makes this sustainable: relatively predictable demand (people keep drinking soda regardless of economic cycles), high margins on syrup concentrate, low capital expenditure requirements, and global distribution that generates cash in over 200 countries. The cash flow is durable enough that the company has increased its dividend for over 60 consecutive years.
The trade-off. Dividend-heavy companies tend to be mature businesses with limited reinvestment opportunities. If a company is paying you 4% of earnings as dividends, that is 4% it is not reinvesting in growth. For Coca-Cola, this is fine — the global soda market is not going to double. For a company with large reinvestment opportunities, paying dividends can actually signal that management has run out of ideas for deploying capital at high returns. The same action — paying a dividend — means different things in different contexts. An agent will not tell you which context applies unless you ask.
What to watch for in agent output. When an agent presents a company's dividend yield, ask two follow-up questions. First: what is the payout ratio — the percentage of earnings being paid as dividends? A 30% payout ratio is comfortable. An 80% payout ratio means the company is distributing nearly everything it earns, leaving little room for error. Second: how does the free cash flow compare to the dividend? A company can pay dividends from debt or by selling assets, not just from operations. If dividends exceed free cash flow for more than a year or two, the dividend is being funded by borrowing — which is unsustainable. Agents will compute these numbers accurately. Whether the numbers signal a problem requires judgment the agent will not supply on its own.
Source 2 — Earnings growth: the engine
Earnings growth is the company becoming more profitable over time — generating more cash from operations, expanding margins, growing revenue, or some combination. This is the source of return that gets the most analytical attention, because it connects directly to the business's competitive position and the quality of its management.
The archetype: NVIDIA. From 2019 to 2024, NVIDIA's earnings per share grew from roughly $1.50 to over $12 — an eightfold increase in five years. The company's revenue in the data-center segment alone grew from $3 billion to over $47 billion annually. This earnings growth was the primary engine of the stock's rise from around $60 to over $800 in the same period.
The growth was driven by a secular shift — the explosion of AI training demand that required NVIDIA's GPUs in quantities nobody had forecasted. This is what makes earnings growth the most exciting and the most dangerous source of return: it looks obvious in retrospect (of course AI needed GPUs) and was not at all obvious in prospect (in 2019, the consensus view was that NVIDIA was a gaming company with a cyclical side business in data centers).
The trade-off. Earnings growth gets priced in. If a company's earnings grew 30% last year and the market expects 30% again, the stock price already reflects that expectation. You do not earn excess return from expected growth — you earn it from growth that exceeds expectations or from buying at a price that does not fully reflect the growth that materializes. This is the connection between earnings growth and valuation that Chapter 5 will formalize.
There is a subtler problem: growth quality. Not all earnings growth is equal. Revenue growth driven by new customers with high lifetime value is more durable than growth driven by one-time contract wins. Margin expansion from operating leverage (fixed costs spread over more revenue) is more sustainable than margin expansion from cost-cutting that has a floor. Earnings growth funded by massive stock-based compensation is partially illusory — the denominator (shares outstanding) is growing too, diluting each share's claim on the cash flows.
An agent can compute earnings growth rates with precision. What it will not do — unless you ask specifically — is decompose the growth into its quality components: organic vs. acquired, recurring vs. one-time, margin-driven vs. revenue-driven, diluted vs. undiluted. Chapter 4 develops the vocabulary for this decomposition. For now, the principle is: growth is a number, but not all growth is the same number.
What to watch for in agent output. Ask the agent to separate revenue growth from margin expansion. A company whose revenue is flat but whose margins are expanding is a different beast from one whose margins are flat but revenue is surging. They might have the same earnings growth rate and entirely different futures. Also ask about stock-based compensation — if the company is issuing large amounts of equity to employees, the per-share earnings growth understates the dilution happening to your claim. Agents almost never flag stock-based compensation as a concern unless you raise it.
Source 3 — Multiple expansion: the crowd's mood
The price-to-earnings multiple is the market's shorthand for how much investors are willing to pay per dollar of earnings. A stock trading at 20x earnings means investors pay $20 for every $1 the company earns. If that multiple expands to 30x — meaning investor enthusiasm increases — the stock rises 50% even if the company's earnings do not change at all.
The archetype: JPMorgan Chase. Large bank stocks historically trade at lower multiples than technology or consumer companies. JPMorgan traded at roughly 10x earnings through much of the 2010s. By 2024, the multiple had expanded to roughly 13x, reflecting increased confidence in the bank's competitive position and improved return on equity under Jamie Dimon's management. That 30% expansion in multiple contributed meaningfully to total return even though the company's business model did not fundamentally change.
Multiple expansion is the source of return that is hardest to predict and most tempting to rely on. It is, in essence, a bet that other investors will become more optimistic. There is nothing wrong with this bet if you understand what you are betting on. The problem arises when people attribute their returns to earnings growth when the actual source was multiple expansion — because multiple expansion can reverse quickly and without warning.
The trade-off. Multiples reflect a combination of growth expectations, risk perception, interest rates, and collective mood. When interest rates were near zero (2020-2021), multiples expanded across the market — investors were willing to pay more for earnings because the alternative (bonds paying near-zero) was unattractive. When rates rose (2022-2023), multiples compressed even for companies whose earnings continued to grow. If you bought at high multiples and attributed the price to company quality rather than the interest rate environment, the rate hikes felt like the company betrayed you. It did not. You misidentified the source of your return.
Howard Marks captured this dynamic precisely: "Being too far ahead of your time is indistinguishable from being wrong." A company can have excellent fundamentals and still deliver negative returns for years if you buy it at a multiple that reflects more optimism than the market sustains. The multiple is not something you control. It is something you understand or you do not.
What to watch for in agent output. Agents love to report P/E ratios, and the number is easy to compute. But a P/E ratio without context is meaningless. Ask the agent for the historical range of the multiple — what has this company traded at over the past five and ten years? Ask how the current multiple compares to the sector median. And ask what assumptions about growth would justify the current multiple. If the agent says a company trades at 40x earnings, and the implied growth rate to justify that multiple is 25% annually for the next decade, you can judge whether that growth rate is realistic. If it says the same company trades at 15x earnings and the implied growth rate is 5%, the risk-reward calculus changes entirely. The number without the context is noise.
Why the decomposition matters for this curriculum
Every chapter from here through Chapter 7 connects back to this decomposition.
- Chapter 4 teaches you to read financial statements as patterns — the patterns tell you about earnings quality, growth durability, and cash flow reality. These are the inputs to Source 2.
- Chapter 5 teaches valuation as narrative — every assumption in a DCF model maps to a belief about one or more of the three sources. The sensitivity analysis in Chapter 5 will ask: which source is your return bet implicitly relying on?
- Chapter 6 teaches risk — and the primary risk in investing is misidentifying which source your return is coming from, then getting surprised when that source disappears.
- Chapter 7 teaches thesis discipline — a written thesis includes a specific claim about which sources of return you expect and under what conditions you would change your mind.
If you skip this vocabulary, those chapters become recipes you follow without understanding. Recipes break when the ingredients change.
3. Why markets are hard to beat — and what that does and does not mean
Most people who start investing believe they will beat the market. The data is unambiguous: most of them will not.
S&P Dow Jones publishes the SPIVA scorecard annually. The 2024 report showed that over the preceding 15 years, approximately 88% of actively managed U.S. large-cap funds underperformed the S&P 500. These are not amateurs. These are teams of professionals with Bloomberg terminals, proprietary data, decades of experience, and millions in research budgets. Nearly nine out of ten failed to beat a simple index.
The natural reaction to this statistic is either despair (why bother?) or denial (I am different). Both reactions are wrong. The correct reaction is to understand why markets are hard to beat, because the reason tells you what kinds of advantage are actually available.
The efficient market hypothesis — what it says, what it does not say
Eugene Fama formalized the efficient market hypothesis (EMH) in 1970. In its simplest version, EMH says that asset prices reflect all available information. If a company announces great earnings, the stock adjusts immediately — by the time you read the headline, the price already reflects the news.
There are three forms, and the distinction matters:
Weak form: prices reflect all past trading data. You cannot reliably make money by looking at historical price charts. Technical analysis — drawing trend lines, identifying "head and shoulders" patterns, computing moving-average crossovers — does not produce consistent edge. The evidence for weak-form efficiency is strong and has been replicated across markets and time periods.
Semi-strong form: prices reflect all publicly available information, including financial statements, news, analyst reports, and management commentary. This is the form that is most relevant to individual investors. It means that reading a 10-K does not automatically give you an advantage, because the information in it has already been digested and priced by thousands of other participants. The evidence here is mixed — prices generally adjust quickly to public information, but not always instantaneously and not always correctly.
Strong form: prices reflect all information, including private insider information. This form is clearly false — insider trading is profitable and illegal precisely because insiders possess price-relevant information that the market has not incorporated. Nobody takes strong-form EMH literally.
For our purposes, semi-strong efficiency is the relevant claim. And the nuance matters: it does not say markets are perfectly efficient. It says markets are efficient enough that beating them consistently, after costs, is very difficult for most participants.
Why this is not a reason to give up
There is a common logical error that goes: markets are efficient → I cannot beat the market → I should just buy the index → investment analysis is pointless.
Each arrow in that chain contains a flaw.
"Markets are efficient" is a statement about averages. The SPIVA data shows that 88% of professionals underperform — which means 12% outperform. Over rolling 15-year periods, the outperformers are not random. Some names recur: Berkshire Hathaway, Renaissance Technologies, a handful of value-oriented funds. The outperformance is real, not a statistical artifact. EMH explains why it is rare. It does not explain why it is impossible.
"I should just buy the index" is actually excellent advice for most people most of the time. It is the highest-returning strategy that requires zero judgment. If your goal is to participate in economic growth without spending time on analysis, an index fund is the correct answer and this curriculum is not for you.
"Investment analysis is pointless" does not follow from the preceding claims. Investment analysis is difficult to profit from consistently — which is different from pointless. The analysis builds understanding. Understanding improves judgment. Judgment, applied over decades, is what separates the 12% from the 88%. Whether you choose to use that judgment for active stock-picking, for intelligently tilting your portfolio, for understanding the economy you live in, or simply for knowing when financial advice is nonsense — the skill has value beyond its direct return.
The honest framing for this curriculum is: you are building judgment that might give you an edge over time, using agents to accelerate the learning process that used to take decades. The training ground is valuable even if you ultimately decide that index investing is the right strategy for your money. Knowing why you are indexing — because you understand the difficulty of beating the market and have chosen not to try — is a fundamentally different position from indexing because you do not understand the alternative.
Noise traders and the price discovery problem
Markets would be perfectly efficient if every participant were rational and fully informed. They are not. A significant fraction of market activity is driven by what Fischer Black (of Black-Scholes fame) called "noise traders" — participants who trade on signals that have no actual information content. Memes, technical patterns, tips from a friend, gut feelings about a CEO's body language on an earnings call.
Noise traders are not a minor sideshow. They provide the liquidity that makes markets function. Without noise traders, information-driven traders would have nobody to trade against, and the market would be less liquid and more volatile. But noise traders also create temporary mispricings — moments when the price of an asset diverges meaningfully from its underlying cash-flow value.
These mispricings are the opportunity for informed investors. They are also temporary — the market corrects them, usually within weeks to months. This creates a paradox: the mispricing exists because noise traders created it, and it gets corrected because informed traders exploit it. The cycle repeats. The window of opportunity is real but narrow, and it requires you to be right about the value, right about the direction of correction, and patient enough to wait.
For individual investors using agents, the relevant insight is this: the mispricings that agents can help you identify are usually the ones that have already been identified by faster, better-resourced participants. Bloomberg terminals surface pricing anomalies before your agent finishes reading the 10-K. The mispricings that remain accessible to you tend to be in less-followed companies, during periods of broad market panic (when even institutional investors sell indiscriminately), or in areas where you have domain expertise that the market lacks.
This connects directly to the concept of edge — which is the subject of the next section.
4. Five types of edge
If markets are hard to beat, then beating them requires an advantage — something you have that the other participants do not. In investing, that advantage is called edge. There are five types, and they differ enormously in accessibility.
Edge 1 — Time horizon
Most institutional investors operate on quarterly or annual cycles. Fund managers are evaluated on 12-month performance. Quarterly earnings cause stocks to move 5-10% on results that cover 90 days of business operations. This short-termism is structural — fund managers face redemption risk, career risk, and benchmark-comparison pressure that makes it rationally difficult for them to hold a position through a multi-year thesis.
Individual investors face none of these structural constraints. You have no clients demanding quarterly performance. You have no benchmark you must beat or lose your job. You can buy a stock today, watch it decline 20% over six months because of a temporary headwind, and hold it for five years while the thesis plays out — provided you sized the position so the drawdown does not force you to sell.
This is the most accessible edge for individual investors, and it is paradoxically the one least discussed. Buffett has been articulating it for decades: "Our favorite holding period is forever." This is not sentimentality. It is a structural advantage. When you can hold longer than the institutions that set prices in the short term, you can profit from their inability to do the same.
The trade-off. Time-horizon edge requires patience, and patience is a real cost. Money locked in a position for five years cannot be deployed elsewhere. If your thesis is wrong, five years of patience is five years of opportunity cost. Worse, the psychological strain of holding through drawdowns is severe — the price dropping 30% and your conviction remaining constant is easy to describe and extraordinarily difficult to experience. Most people who claim to have a long time horizon discover during the first serious drawdown that they do not.
There is also a knowledge requirement. Holding longer does not help if your thesis is wrong. It makes it worse — you compound the error across years instead of cutting it quickly. Time-horizon edge is only edge when combined with correct analysis. Alone, it is stubbornness.
Edge 2 — Behavioral
Humans are not rational. We are predictably irrational, in patterns that psychologists have catalogued for decades: loss aversion (losses hurt roughly twice as much as equivalent gains feel good), anchoring (the first number you see biases every subsequent judgment), confirmation bias (you seek evidence that supports what you already believe), and recency bias (recent events feel more representative than they are).
These biases are not defects — they are features of human cognition that serve us well in most contexts. They become liabilities in investing because the market systematically exploits them. When prices drop, loss aversion screams "sell before it gets worse." When a stock doubles, anchoring whispers "it was cheaper before, I missed it." When your thesis is wrong, confirmation bias curates the evidence so you do not notice.
Behavioral edge means recognizing these patterns in yourself and acting against them — or, more practically, designing systems that prevent them from affecting your decisions. Writing a thesis down before you buy (Chapter 7) is a behavioral-edge tool: it creates a fixed reference point that your memory cannot silently revise. Setting kill criteria in advance is another: you decide when you will sell before the emotional pressure of a drawdown makes the decision for you.
The trade-off. Knowing about cognitive biases does not immunize you against them. This is the central finding of forty years of behavioral economics research: awareness reduces but does not eliminate the effect. You will still feel loss aversion during a drawdown. You will still seek confirming evidence for your thesis. The edge comes from the system you build around the bias, not from the knowledge that the bias exists. And the system requires discipline, which is itself a psychological resource that depletes under stress.
Agents have an interesting role here: they do not have cognitive biases in the human sense. An agent asked to red-team your thesis will do so without loss aversion, without anchoring, without caring whether you feel good about the result. This makes agents useful as behavioral counterweights — but only if you actually listen to the output. The most common failure mode is asking the agent to red-team your position and then dismissing the result because it conflicts with what you want to believe. The agent is not the bottleneck. Your willingness to act on its output is.
Edge 3 — Informational
Informational edge means knowing something that other market participants do not know. This was the dominant form of edge for most of the twentieth century — analysts who visited factories, talked to customers, and tracked shipping containers had information that was not yet reflected in stock prices.
In 2026, pure informational edge is the hardest to achieve legally. Regulation Fair Disclosure (Reg FD) in the U.S. requires companies to disseminate material information to all investors simultaneously. Insider trading laws make it illegal to trade on material non-public information. The remaining legal informational edge comes from alternative data — satellite imagery of parking lots, credit card transaction aggregates, app download statistics, supply chain tracking — and this data is expensive, often costing tens of thousands of dollars per dataset per year.
For individual investors, informational edge is largely unavailable in its pure form. You are not going to know something about Apple that the market does not know. Where a version of informational edge exists is at the edges: small-cap companies that no analyst covers, industry-specific knowledge from your own work experience, or ground-level observations about a product or market that have not been quantified into a data feed yet.
The trade-off. The temptation is to overestimate your informational edge. Seeing that a restaurant chain is busy in your city is not informational edge — it is one data point in one market, and the company's stock price reflects aggregate demand across all markets. True informational edge requires that your information is both accurate and not yet reflected in the price. The second condition is much harder to verify than the first.
Peter Lynch's famous advice — "invest in what you know" — is often misunderstood as informational edge. What Lynch actually meant was that familiarity with a product or industry gives you a head start in asking the right analytical questions. Knowing a product is good because you use it is not an investment thesis. Knowing why it is good, how the business model works, and what would have to change for the product to stop being good — that is the beginning of a thesis, and it draws on all five types of edge, not just information.
Edge 4 — Analytical
Analytical edge means processing the same publicly available information more effectively than other participants. The information is the same; the conclusions you draw are different — and better.
This is the edge that investment education traditionally tries to build. Read the 10-K more carefully. Build a more sophisticated model. Understand the industry dynamics more deeply. Draw connections between data points that other analysts miss.
In the pre-agent era, analytical edge was scarce because analysis was labor-intensive. A retail investor could not realistically analyze a company with the same thoroughness as a team of institutional analysts. In 2026, agents closed the throughput gap on standard analytical tasks — computing ratios, comparing companies, flagging anomalies. The gap that remains is in what to look for and how to interpret what you find. This is the intersection of analytical edge and domain knowledge.
The trade-off. Analytical edge based on standard financial analysis is rapidly commoditizing. If your edge is "I read the 10-K and computed the ratios" — an agent does that faster and more accurately. The surviving forms of analytical edge are: connecting information across domains (a skill Munger called the "latticework of mental models"), recognizing patterns that require industry-specific context, and formulating non-consensus interpretations of publicly available data. These are harder to automate because they require the kind of judgment this curriculum is designed to build.
Charlie Munger's contribution to investment thinking was precisely this: the best analytical edge comes not from being a better financial analyst, but from integrating financial analysis with knowledge from other fields — psychology, history, physics, biology. A financial analyst can tell you that a company's customer acquisition cost is rising. Integrating that with an understanding of competitive dynamics (is the market saturating?) and behavioral economics (are customers becoming less loyal to the category?) produces a different and deeper conclusion. Agents can assist with each component, but the integration — deciding which lenses to apply and how to weight their signals — remains a human judgment call.
Edge 5 — Structural
Structural edge comes from being a different type of market participant than the majority. Institutional investors face constraints that individuals do not: minimum position sizes (a $10 billion fund cannot meaningfully invest in a $200 million market-cap company), mandate restrictions (a large-cap growth fund cannot buy a small-cap value stock even if it is the best opportunity available), and liquidity requirements (a mutual fund must be able to sell its positions to meet redemption requests).
These constraints create systematic mispricings that individual investors can exploit. Small-cap stocks are chronically under-analyzed because institutions cannot hold them in meaningful size. Stocks removed from indices decline mechanically as index funds sell — regardless of the company's fundamentals. Companies in the gray zone between "growth" and "value" may be neglected by both growth and value funds.
The trade-off. Structural edge is real but comes with its own structural costs. Small-cap stocks are less liquid — which means you cannot buy or sell large amounts without moving the price. Under-analyzed companies may be under-analyzed for good reasons — they may be poorly governed, unprofitable, or in declining industries. The structural edge exists because the structural disadvantages are real. You are paid for bearing the costs that institutions avoid.
Which edges are realistically available
Here is the honest assessment:
| Edge type | Availability to individuals | Durability |
|---|---|---|
| Time horizon | High — no clients, no quarterly pressure | High, if you have the psychology |
| Behavioral | Moderate — requires systems and discipline | Moderate, degrades under stress |
| Informational | Low — expensive data, legal constraints | Low for public companies |
| Analytical | Moderate — agents help, judgment is yours | Moderate, commoditizing for standard analysis |
| Structural | Moderate — small caps, neglected names | High, but illiquidity is a real cost |
The two most accessible edges for individual investors are time horizon and behavioral. Neither requires special data, expensive tools, or institutional access. Both require self-knowledge and discipline. This is why Chapter 7 exists — the thesis discipline framework is a behavioral-edge and time-horizon-edge system in one.
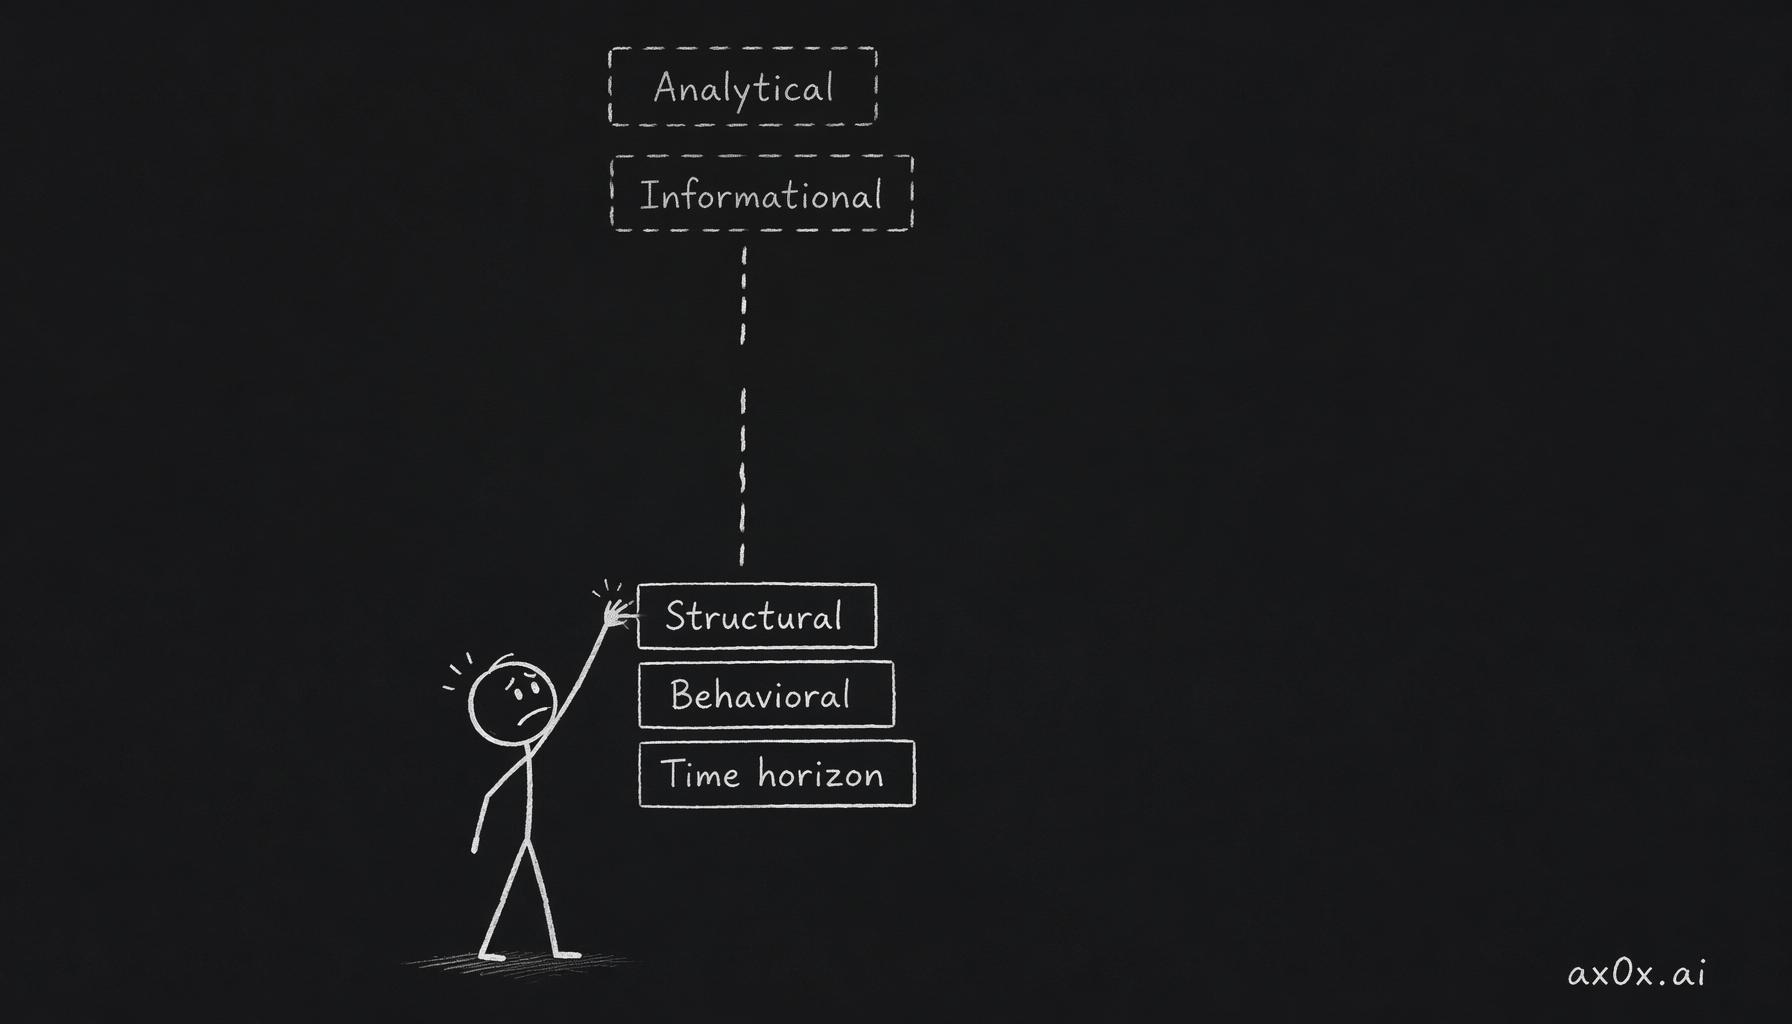 Of the five types of investing edge, individuals can only reach time horizon, behavioral, and structural — informational and analytical stay out of reach
The most common mistake is chasing informational edge — believing you know something the market does not — when your actual available edge is time horizon and behavioral discipline. The second most common mistake is believing you have analytical edge when you are actually processing the same information in the same way as every other person who asked an agent to analyze the same company.
5. Where agents fit — and where they do not
This section connects the first-principles framework to the agent workflow you have been developing since Chapter 1.
What agents do well in this framework
Return decomposition. An agent can pull historical stock prices, dividends paid, and earnings data, then decompose total return into the three sources. This is arithmetic, and agents do arithmetic correctly. The output gives you a factual basis for asking "which source drove the return, and is that source likely to persist?" The agent computes. You judge.
Efficient market testing. Ask an agent: "What is the consensus view on this company? What does the current price imply about future growth?" The agent will synthesize analyst reports, recent earnings commentary, and market pricing into a consensus narrative. This is not the agent being lazy — it is the agent doing exactly what you need. The consensus is the baseline. Your thesis is your departure from it. You cannot depart from something you have not mapped.
Edge identification. An agent can help you articulate which type of edge you believe you have. Ask it to challenge your claimed edge: "I think I have an analytical edge because I understand AI infrastructure better than most investors. What would I need to know that I might not know?" The agent's response will not be authoritative — it cannot verify your actual knowledge — but it will surface blind spots you have not considered.
Historical pattern matching. "Find three historical cases where a company's multiple expanded from 15x to 30x and the expansion held for more than five years. What did those companies have in common?" The agent can pull this together, and the patterns are genuinely informative for testing your own assumptions.
What agents cannot do in this framework
Determine your edge. The agent does not know what you know. It cannot tell you whether your understanding of AI infrastructure gives you analytical edge, because it cannot assess the depth or uniqueness of your understanding. Only you can assess that, and most people overestimate.
Tell you which source of return to bet on. The decomposition is arithmetic. The judgment about which source will drive future returns is a thesis — it depends on beliefs about the future that are irreducibly uncertain. The agent can lay out scenarios, but choosing between them is your job.
Know when consensus is wrong. The agent defaults to consensus. When consensus is right — which it usually is, by definition — the agent's output is reliable. When consensus is wrong — which is when the most money is made — the agent will reflect the wrong consensus with the same confidence it reflects the right one. You need enough understanding of the business to recognize when the consensus narrative does not match the cash-flow reality. That is what Chapter 4 teaches.
Replicate Bloomberg's proprietary advantages. Bloomberg terminals have real-time institutional position data, proprietary analyst call transcripts, counterparty information, and news feeds that are faster than anything available through public APIs. These are genuine advantages that agents accessing public data cannot replicate. For learning — which is the purpose of this curriculum — public data is sufficient. For competing with institutional investors on information speed, it is not. Being honest about this boundary matters.
The training ground framing
The most productive way to think about agents in investing is as a training ground for judgment, not as a shortcut to returns.
Every time you ask an agent to decompose a return and then argue with its conclusion about which source will persist, you are building the pattern recognition that experienced investors develop over decades. Every time you ask an agent to identify the consensus view and then articulate why you disagree, you are practicing the analytical independence that separates the 12% from the 88%.
The agent does not give you edge directly. It gives you hundreds of at-bats per year — practice swings at judgment calls that used to require either institutional access or months of manual work per company. The skill that compounds is not the agent's output. It is your ability to evaluate the output and know when it is wrong.
Workshop — Decompose a return, argue with it
Time: 45–60 minutes. Tools: Any AI agent you already have. Output: A saved document, one to two pages. You will reference it in Chapter 5.
Instructions
Step 1 — Pick a stock you have followed for at least a year. Either one you own, one you sold, or one you seriously considered. The key is that you have some prior beliefs about this company — this workshop tests those beliefs against the decomposition.
Step 2 — Ask your agent to decompose the stock's total return over the last 10 years into three components. Use a request like: "Pull the 10-year total return for [ticker] and decompose it into three sources: dividend contribution, earnings growth contribution, and multiple expansion contribution. Show me the approximate percentage each source contributed to the total return. Use actual historical data, not estimates."
If the stock has existed for less than 10 years, use its full public trading history.
Step 3 — Read the decomposition. Which source contributed the most? Were you surprised? Most people are — the dominant source is rarely what they assumed.
Step 4 — Ask the agent a follow-up: "Which of these three sources is most likely to continue for the next five years, and why?" Read the answer. Notice what the agent assumes about the future. Notice whether its reasoning is specific or generic.
Step 5 — Argue with the answer. Write three to five sentences explaining why you agree or disagree with the agent's assessment of which source will persist. Be specific. "I disagree because the multiple is already at a 20-year high and the growth rate that would justify it requires the company to maintain 30% revenue growth in a market that is showing signs of saturation" is useful. "I disagree because it seems too optimistic" is not.
Step 6 — Identify your implicit edge. Write one sentence answering: "What kind of edge am I claiming by disagreeing with the agent's consensus view?" Refer to the five types. If you cannot identify a specific edge, that is informative — it may mean your disagreement is emotional rather than analytical.
Step 7 — Save the document with the company ticker and today's date. You will use it in the Chapter 5 valuation workshop to test whether your beliefs about which return source will persist are reflected in the assumptions of a DCF model.
Why this matters
The decomposition is not the point. The argument is. Every investor has beliefs about the companies they follow — beliefs about growth, about competitive position, about where the return comes from. Most of those beliefs have never been tested against arithmetic.
When the decomposition shows that 60% of your favorite stock's return came from multiple expansion and only 15% from earnings growth, and you thought the story was about earnings growth — that gap between belief and arithmetic is the most valuable thing this workshop produces. It is the gap that costs money when left unexamined.
You now have the vocabulary to decompose any return, the framework to understand why markets are hard to beat, and a taxonomy of edges to be honest with yourself about where your advantage actually lies. The next chapter — Chapter 4: Reading a Company — teaches you to read the financial statements that produce the cash flows you are now buying.
The most important thing this chapter teaches is not a technique. It is a question: when someone tells you a stock returned 200% in five years, the question is not "how do I get that return?" The question is "where did that return come from — and is the source still running?"
Next: Chapter 4 covers the three financial statements as three lenses — business structure, fragility, and truth. Do the workshop above before moving on. The decomposition you save will reappear in Chapter 5.