Capstone Workshop — Three Companies, One Position
Chapter 9 of 10 in the AI-Native Investor curriculum.
This chapter is not a reading chapter. It is a workshop that uses everything from the previous eight chapters — the bottleneck shift, the four agent roles, first principles, financial statement reading, valuation, risk, thesis discipline, and fleet architecture — collapsed into a single end-to-end workflow.
The output is three investment memos and one decision: buy one, skip all three, or mark one for revisit. All three outcomes are valid. "Skip" is not a consolation prize. It is a position — the position that none of these companies meet your bar, and your capital stays where it is until something does.
Expected time: 4 to 8 hours across multiple sittings. Do not attempt this in one session. Fatigue degrades judgment, and judgment is the entire point.
What you need: An AI agent (Claude, or any capable model). Access to public financial data (SEC EDGAR, company investor relations pages). The documents you created in earlier workshops — particularly your Chapter 1 framework pixel and your Chapter 7 thesis template. A quiet folder or notebook where you will save the outputs from each phase.
Table of contents
- Why this chapter is different
- Rule zero — circle of competence
- Phase 1 — Data review and verification
- Phase 2 — Three-lens reading
- Phase 3 — Valuation
- Phase 4 — Risk analysis and pre-mortem
- Phase 5 — Thesis writing and red team
- Phase 6 — Decision
- Phase 7 — Memo and review date
- Reflection
1. Why this chapter is different
Every previous chapter had a structure: concepts taught, then a workshop at the end to practice them. This chapter inverts that ratio. The entire chapter is the workshop. The instruction sections exist only to tell you what to do next and remind you which earlier chapter's framework applies.
The reason for the inversion is simple: investment analysis is not a set of independent skills. It is a pipeline where each stage feeds the next, and the quality of the final decision depends on how well the stages connect. You can understand valuation perfectly in isolation and still produce a bad valuation if your data review missed a material liability, or if your three-lens reading failed to catch that the company's reported earnings diverge sharply from its cash flows. The connections between stages are where most mistakes happen, and you cannot practice connections by practicing stages in isolation.
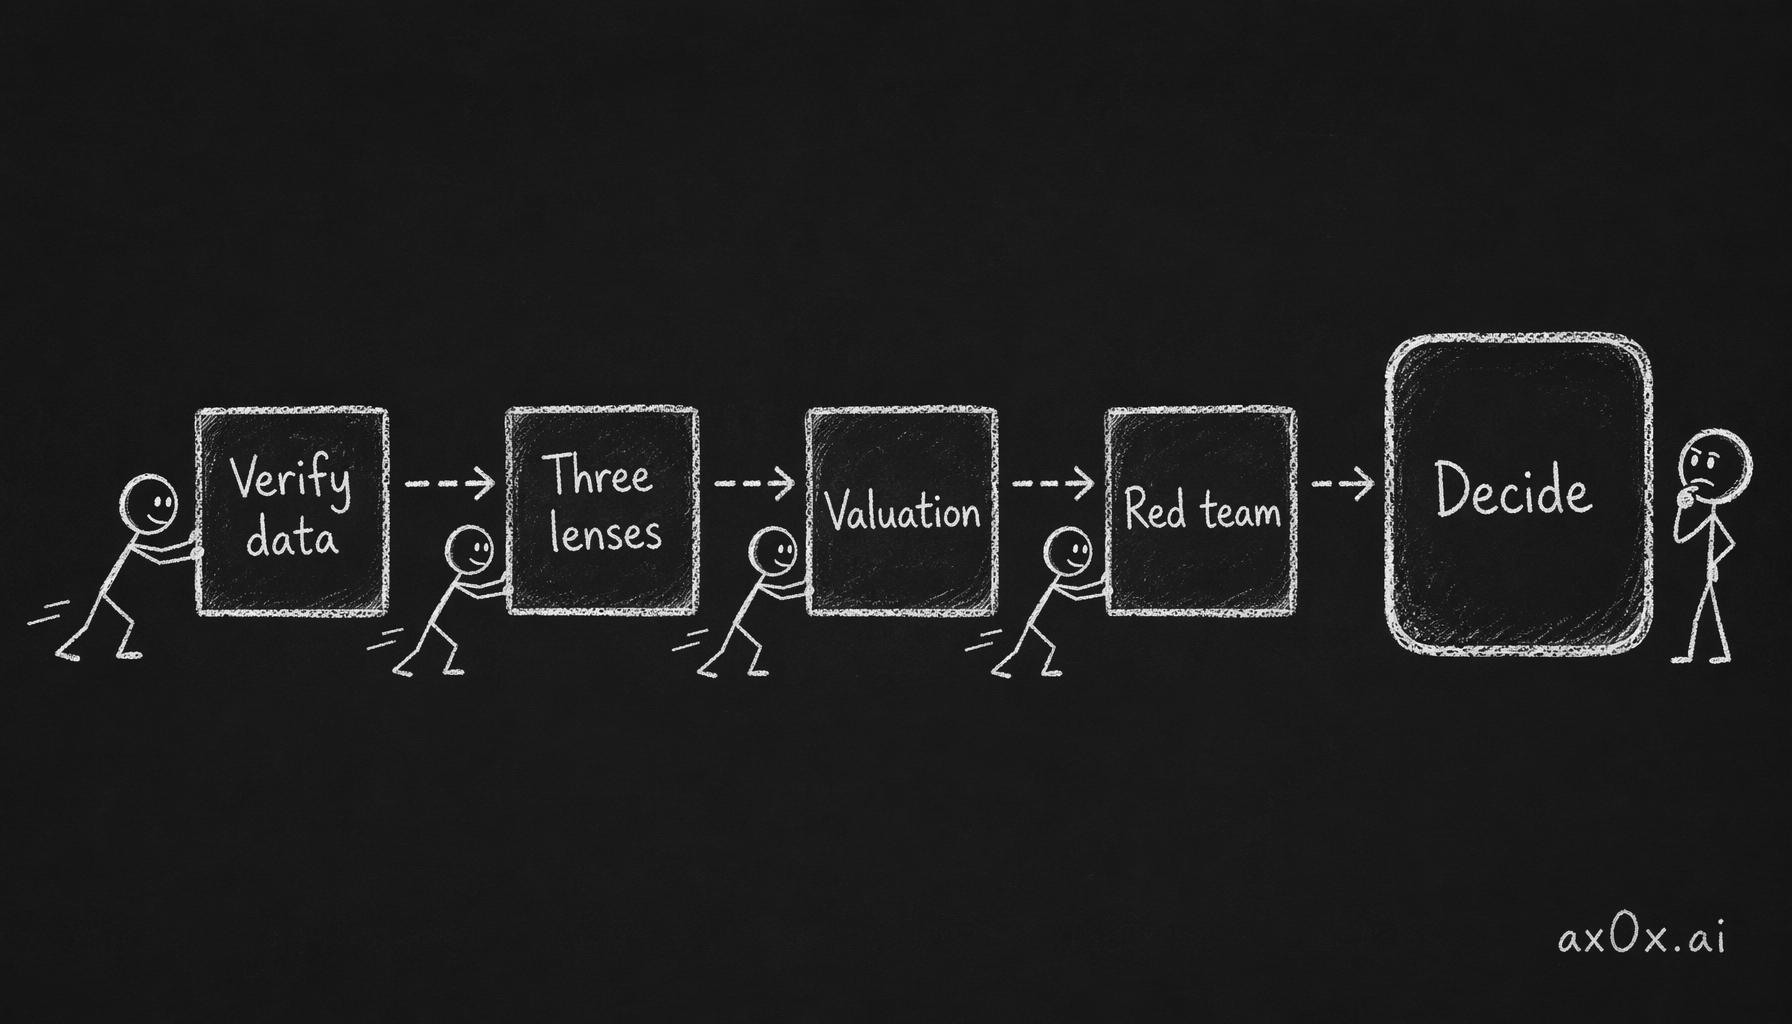 The seven phases form one end-to-end pipeline where each stage's output feeds the next, converging on a single buy-or-skip decision.
This workshop forces the connections. You will move through seven phases, each building on the previous one's output. By the end, you will have three complete memos and a decision — or a reasoned refusal to decide.
What this workshop will not give you
It will not give you a stock pick. The point is not which company you choose. The point is whether you can defend the choice — or the decision not to choose — against a competent adversary. If you complete this workshop and cannot articulate, in plain language, why your decision is correct and under what conditions it would become wrong, the workshop failed regardless of which ticker you wrote down.
It will not give you confidence you are right. If you finish feeling confident, something went wrong. The correct feeling at the end is: "I have a defensible position, I know exactly what would break it, and I have a plan for when to revisit." Confidence without conditions is a belief, not a thesis. Chapter 7 drew this distinction. This workshop is where you live it.
How to use agents in this workshop
Each phase specifies which agent roles to use, following the four-role framework from Chapter 2. The general pattern:
- Analyst role for data gathering and computation. This is the workhorse — most of phases 1 through 3 use this role.
- Tutor role when you encounter a concept or metric you do not understand well enough to judge the output. Do not skip this. Accepting a number you do not understand is worse than taking ten minutes to learn what it means.
- Red team role in phases 4 and 5, where you need someone attacking your position.
- Executor role only for repeatable data pulls — once you know what you want, have the agent run it identically across all three companies.
One critical rule from Chapter 8: when all three of your agent queries produce the same conclusion about a company, that is a signal to push harder, not a signal to relax. Unanimous agreement from agents almost always means you are asking consensus questions. The value is in the places where different framings produce different answers.
2. Rule zero — circle of competence
Before you pick three companies, you need to answer one question honestly: what do you actually understand?
Warren Buffett's circle of competence is the most misunderstood concept in investing. People interpret it as "invest in what you know," which sounds like Peter Lynch's supermarket thesis — you shop at Costco, so buy Costco. That is a starting point, not a circle of competence. A circle of competence means you understand the business well enough to have an informed view on its future — not just its products, but its economics. How it makes money. Why customers stay or leave. What would have to change for the business to deteriorate, and how you would recognize that change before the stock price reflected it.
Most people's honest circle of competence is narrower than they think. That is fine. The exercise below is designed to surface yours.
Exercise: mapping your circle
Take ten minutes. No agent. Write down answers to these four questions:
1. What industries do you interact with as a customer, employee, or close observer? Not "I read an article about AI chips" — that is not observation, that is secondhand narrative. Industries where you have direct experience. You work in healthcare and see how purchasing decisions are made. You run a restaurant and understand food supply chains. You build software and know which tools your team actually uses versus which ones get press coverage.
2. For each industry, what do you know that a generalist analyst probably does not? This is where honest self-assessment matters. If your answer is "nothing" — that industry is outside your circle. If your answer is "I know that enterprise software purchasing decisions take 6 to 18 months and the real decision-maker is usually not the person the sales team pitches to" — that is inside your circle. Specificity is the test.
3. What industries do you find yourself naturally tracking without being paid to? Some people read semiconductor earnings transcripts for fun. Some people track restaurant same-store sales because they care about food. The things you follow voluntarily are candidates for your circle, because voluntary attention is sustainable and forced attention is not.
4. Where have you been wrong before, and do you understand why? A circle of competence is not a circle of omniscience. If you have been wrong about a company in an industry you thought you understood, and you can explain specifically why you were wrong, that industry is still in your circle — probably more securely than before. If you were wrong and do not know why, the industry is less inside your circle than you thought.
Picking three companies
From your circle of competence, choose three companies that meet all of the following criteria:
Publicly traded with at least three years of public financial history. You need enough data for the three-lens reading in Phase 2 to be meaningful. A company that IPO'd six months ago does not have enough history.
In different sectors or sub-sectors. This is not about diversification — you are not building a portfolio in this workshop. It is about forcing yourself to apply the same framework to different business types. A SaaS company, a retailer, and a bank will stress-test your process differently than three SaaS companies would.
Companies you could explain to a friend in two minutes. Not "it's a cloud company" — that is a sector label, not an explanation. "It sells pick-and-shovel infrastructure to AI companies, makes most of its money from data center GPUs, and its biggest risk is that its largest customers are building their own chips" — that is an explanation. If you cannot produce the two-minute version without looking anything up, the company is outside your circle for this exercise.
Not meme stocks, not companies you have a tribal identity around. If your relationship with a company is primarily emotional — you are a superfan of its products, you have been arguing about it on social media, your identity is partially wrapped up in whether the stock goes up — pick a different company. Emotional attachment is the enemy of the red-team process in Phase 5. You will rationalize instead of analyze.
Write down your three companies. Ticker symbols, the two-minute explanation for each, and which of the four questions above placed them inside your circle. This document is the input to Phase 1.
Phase 1 — Data review and verification
Time estimate: 45 to 90 minutes across three companies. Agent roles: Analyst (primary), Tutor (as needed). Chapter reference: Chapter 4 — Reading Companies, verification protocol.
What you are doing
Gathering the raw financial data for all three companies and verifying that the data is accurate before you start analyzing it. This is the least exciting phase and the most important one to do carefully. An error in the data propagates through every subsequent phase. A wrong revenue number in Phase 1 becomes a wrong margin trend in Phase 2, a wrong valuation in Phase 3, and a wrong thesis in Phase 5.
Instructions
Step 1 — For each company, ask your agent to pull the following from the most recent annual filing (10-K or equivalent):
- Revenue, operating income, and net income for the last three to five fiscal years
- Total assets, total liabilities, total equity, and long-term debt for the same period
- Operating cash flow, capital expenditures, and free cash flow for the same period
- Share count (diluted) for the same period
- Any material acquisitions or divestitures in the last three years
Specify that you want the data in a consistent table format across all three companies, with the same fiscal years aligned. If a company has a non-standard fiscal year (ending in June or September rather than December), note it — you will need this context in Phase 3.
Step 2 — Spot-check at least two numbers per company against the original source. Go to SEC EDGAR (for US companies) or the company's investor relations page. Pull up the actual 10-K or annual report. Find the revenue line and one balance sheet line (total debt is a good choice). Compare against what the agent provided.
This step is non-negotiable. Chapter 4 explained why: agents pull data from aggregator sources that sometimes lag, round differently, or classify items differently than the original filing. A 2% difference in revenue is rounding. A 15% difference means the agent pulled the wrong line item or the wrong fiscal year. You need to know which one you are dealing with before you build analysis on top of it.
Step 3 — For any discrepancy larger than 3%, ask the agent (in tutor role) to explain the difference. Common causes: the agent used calendar-year data while the company reports on a different fiscal year; the agent included or excluded a discontinued operation; the agent used GAAP revenue while the company prominently reports non-GAAP adjusted revenue. All of these are diagnosable. None of them should be silently accepted.
Step 4 — Create a clean data sheet for each company. Three tables (income statement, balance sheet, cash flow), three to five years of history, verified. Save this. Everything in Phases 2 through 5 builds on it.
What you are looking for already
You are not analyzing yet — that starts in Phase 2. But as you review the data, note anything that surprises you. Revenue that jumped or dropped sharply in one year. Debt that doubled. Free cash flow that went negative. These are not conclusions. They are flags. Write them down in a "questions" column next to the data. You will answer them in Phase 2.
A note on data sources
Bloomberg terminal users have access to cleaner, more granular, and more timely data than what is available through public sources. This is one of the real advantages that agents cannot replicate — not because the agent is not capable, but because the data itself is behind a paywall. For this workshop, public data from SEC filings is sufficient. You are training your judgment, not competing with a hedge fund's data infrastructure. The principles you are practicing here — verification, cross-checking, noting discrepancies — apply regardless of the data source.
Phase 2 — Three-lens reading
Time estimate: 60 to 120 minutes across three companies. Agent roles: Analyst (primary), Tutor (when you hit unfamiliar metrics). Chapter reference: Chapter 4 — Reading Companies, three-lens framework.
What you are doing
Reading each company through the three lenses from Chapter 4: income statement as business structure, balance sheet as fragility, cash flow statement as truth. The goal is not to produce a comprehensive financial analysis. The goal is to identify the two or three signals per company that matter most — the patterns that will drive your valuation assumptions in Phase 3 and your risk assessment in Phase 4.
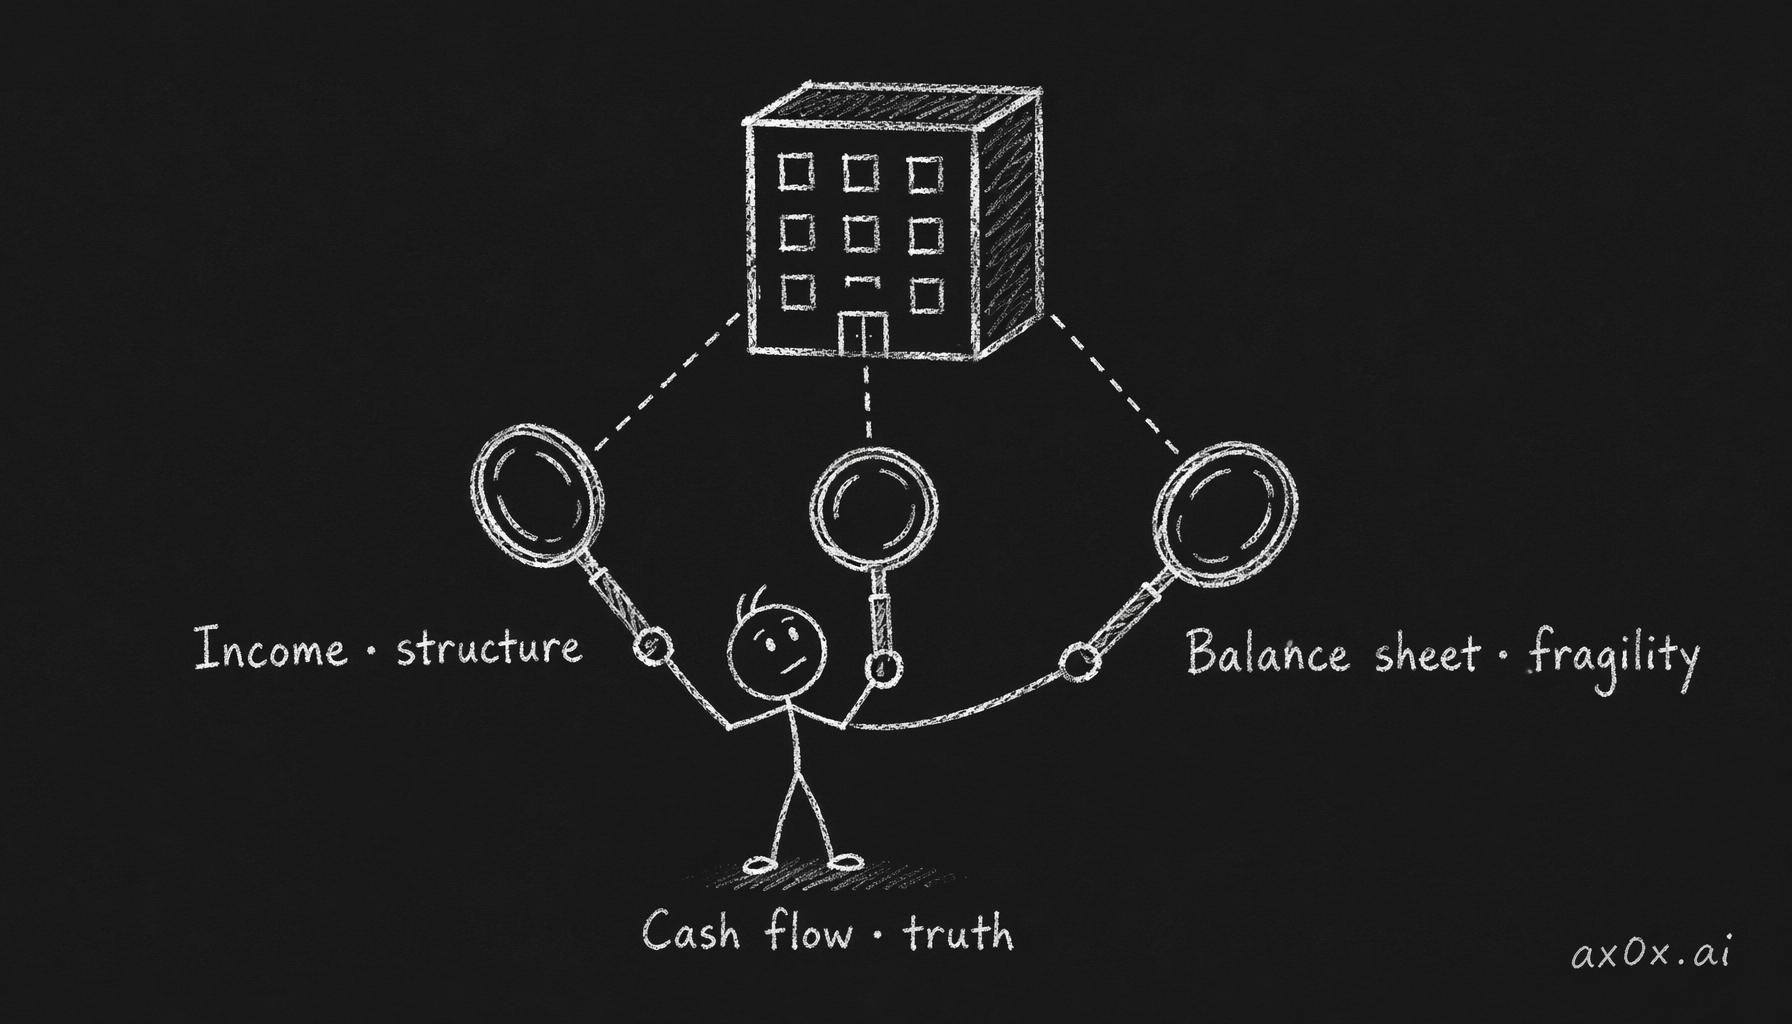 Three lenses on the same company — income statement as business structure, balance sheet as fragility, cash flow as truth.
Lens 1 — Income statement as business structure
For each company, ask your agent to compute and trend the following across the three-to-five-year data set from Phase 1:
- Gross margin trend. Is it expanding, contracting, or stable? A company with expanding gross margins is either gaining pricing power or reducing input costs — both are positive signals, but for different reasons and with different sustainability profiles. A company with contracting gross margins is either losing pricing power or facing cost pressure — and the distinction matters for your thesis.
- Operating margin trend. Same question: expanding, contracting, stable? The gap between gross margin and operating margin is the company's overhead structure. If gross margins are expanding but operating margins are flat, the company is spending more on sales, R&D, or administration as fast as it is improving its unit economics. That is not necessarily bad — a company investing heavily in R&D may be building future moats — but it is a pattern you need to understand.
- Revenue composition. Where does the revenue come from? Product vs. service. Recurring vs. one-time. Domestic vs. international. Customer concentration — does any single customer account for more than 10% of revenue? (This is disclosed in the 10-K.) A company that derives 35% of its revenue from a single customer has a different risk profile than one with thousands of customers each contributing less than 1%.
- Stock-based compensation as a percentage of revenue. This is especially relevant for technology companies. Stock-based compensation is a real cost — it dilutes existing shareholders — but it does not appear in cash flow. A company with 25% of revenue going to stock-based compensation is paying its employees partly by diluting you. The GAAP income statement includes this cost. Non-GAAP "adjusted" figures exclude it. You should know the difference and have a view on which one better represents the company's true economics.
After the agent produces this analysis, read it through a specific question: what business structure does this company have, and is it improving or deteriorating? Write one paragraph per company answering this question in your own words. Not the agent's words — yours. If you cannot write the paragraph without copying the agent's phrasing, you do not understand the analysis well enough yet. Switch to tutor role and ask the agent to explain the metric you are stuck on until you can explain it yourself.
Lens 2 — Balance sheet as fragility
For each company, ask your agent to compute:
- Debt-to-equity ratio and its trend. Rising debt-to-equity means the company is either borrowing more or generating less equity (through losses or buybacks). Neither is inherently bad, but both have implications.
- Debt maturity profile. When does the company's debt come due? A company with $10 billion in debt maturing in 2035 is in a different situation from one with $10 billion maturing in 2027. The maturity wall — the year when a large chunk of debt needs to be refinanced — is one of the most important risk factors for leveraged companies, and it is invisible if you only look at the total debt number.
- Current ratio (current assets divided by current liabilities). Below 1.0 means the company cannot cover its short-term obligations with its short-term assets. This is not an automatic death sentence — many companies operate below 1.0 because they have reliable access to credit — but it is a fragility signal.
- Off-balance-sheet items. Ask the agent to check the notes to the most recent 10-K for operating leases, purchase commitments, legal contingencies, and pension obligations. These are real liabilities that do not always appear on the face of the balance sheet. Enron's balance sheet looked manageable until you read the footnotes about its special-purpose entities. Footnotes are where companies put the information they are required to disclose but would prefer you not notice.
The question for this lens: if this company hit a bad year — revenue dropped 20%, or a major customer left, or interest rates spiked — could it survive without raising emergency capital? Companies with low debt, ample cash, and no maturity wall in the next three years can absorb a bad year. Companies with high leverage, near-term maturities, and thin cash cushions cannot. Write one paragraph per company assessing fragility.
Lens 3 — Cash flow statement as truth
The income statement tells you what the company says it earned. The cash flow statement tells you what actually happened to the cash. The two diverge more often than most people expect, and the divergence is where the most important signals live.
For each company, ask your agent to compute:
- Free cash flow (operating cash flow minus capital expenditures) and its relationship to net income. A company that consistently reports positive net income but negative or much lower free cash flow is converting its reported earnings into cash poorly. The reasons matter: heavy capital expenditure for growth is different from heavy capital expenditure for maintenance. A working-capital build (inventory rising faster than sales) is different from a seasonal pattern.
- Cash flow from operations as a multiple of net income. A ratio well above 1.0 is healthy — the company generates more cash than it reports as earnings, usually because non-cash charges (depreciation, amortization) are significant. A ratio well below 1.0 means the company is reporting earnings it is not collecting as cash. This is not fraud (usually), but it is a yellow flag.
- Capital allocation over the last three years. Where did the cash go? Dividends, buybacks, debt repayment, acquisitions, capital expenditure? This tells you what management values. A company that generates strong free cash flow and spends it all on acquisitions has a different profile from one that returns it to shareholders.
- The quality question. Ask the agent: "Are there any items in cash flow from operations that look like they are inflating the number — such as favorable changes in working capital, or reclassification of items from investing to operating?" This is a direct red-flag check. Not every company does this. The ones that do are worth knowing about before you build a valuation on their cash flow numbers.
The question for this lens: is the cash flow story consistent with the income statement story? If the company says it is growing profitably and the cash flow statement confirms it, that is a clean signal. If the company says it is growing profitably but cash flow is declining or erratic, there is a gap between narrative and reality. Write one paragraph per company on the consistency between reported earnings and actual cash generation.
Synthesizing the three lenses
You now have three paragraphs per company — business structure, fragility, and cash flow truth. Nine paragraphs total. Read them through. For each company, write a summary sentence:
"The pattern I see in [Company] is __________, and the thing I am most uncertain about is __________."
These summary sentences are the input to Phase 3. The pattern is your preliminary narrative — the story you think the numbers are telling. The uncertainty is what your valuation needs to test.
Phase 3 — Valuation
Time estimate: 60 to 120 minutes across three companies. Agent roles: Analyst (computation), Tutor (concepts), Executor (repeatable runs). Chapter reference: Chapter 5 — Valuation.
What you are doing
Building a valuation for each company using the framework from Chapter 5: DCF as a narrative device, multiples as reference points, sensitivity analysis to find the assumption that matters most. The key principle: every number in a valuation is a story choice, and the agent will default to consensus stories unless you bring your own.
Step 1 — Multiples as orientation
Before building a DCF, orient yourself with relative valuation. Ask your agent to compute the following for each company and its two or three closest public competitors:
- Price-to-earnings ratio (P/E) — trailing twelve months and forward estimate
- Enterprise value to EBITDA (EV/EBITDA)
- Price-to-free-cash-flow (P/FCF)
- Price-to-sales (P/S) — especially relevant for companies with low or negative earnings
The point of this step is not to determine whether the stock is cheap or expensive. Multiples alone cannot tell you that — a stock trading at 40x earnings might be cheap if earnings are about to double, and a stock trading at 10x earnings might be expensive if earnings are about to collapse. The point is to understand where the market is pricing each company relative to its peers, and to ask: what story does this multiple imply?
A company trading at a significant premium to its sector usually implies the market expects higher growth, better margins, or a more durable competitive position. A company trading at a significant discount usually implies the market sees risk — but discount to what, and risk of what? These are the questions that feed your DCF.
Write down, for each company: "The market is pricing this company at [X] relative to peers, which implies __________." This is your starting narrative.
Step 2 — DCF with your narrative
For each company, ask your agent to build a basic discounted cash flow model with the following inputs:
- Revenue growth rate for years 1 through 5. The agent will default to consensus analyst estimates. Before accepting these, compare them to the company's actual revenue growth over the last three years, and to the trend you identified in Phase 2. If the consensus projects 15% growth for a company that has been growing at 8% and decelerating, you have a disagreement. That disagreement is valuable.
- Operating margin trajectory. Again, compare the agent's default to the trend from Phase 2. If the company's margins have been compressing and the model assumes expansion, ask why.
- Capital expenditure as a percentage of revenue. Compare to historical.
- Terminal growth rate. This is the growth rate assumed into perpetuity after the explicit forecast period. No company grows faster than the economy forever. 2% to 3% is a standard assumption for mature economies. If the agent uses something higher, ask it to justify the assumption.
- Discount rate (weighted average cost of capital). The agent will compute this. The number matters, but for this exercise, the more important thing is understanding what it represents: the return you require for bearing the risk of owning this company. A higher discount rate means you are demanding more compensation for risk, which reduces the present value.
Do not accept the default output as your valuation. It is the agent's valuation — built on consensus assumptions with no input from your Phase 2 analysis. Your job is to adjust.
Step 3 — Bring your narrative
For each company, change at least one major assumption based on what you learned in Phase 2. Some examples:
- Your three-lens reading showed that the company's gross margins have been compressing for three consecutive years. The consensus model assumes margins stabilize. You think they continue compressing. Change the margin trajectory and see what happens to the valuation.
- The cash flow analysis showed that the company's free cash flow conversion has been deteriorating because of rising capital expenditure. The consensus model uses historical capex ratios. You think capex will be higher because the company is entering a capital-intensive expansion phase. Change the capex assumption.
- The balance sheet analysis showed the company has a significant debt maturity in two years. If it has to refinance at higher rates, its interest expense will rise materially. The consensus model uses the current interest rate. You think the refinancing risk is underappreciated. Change the interest expense or adjust the discount rate.
Ask the agent to rerun the DCF with your adjusted assumptions. Compare the output to the original. The gap between "consensus valuation" and "my-narrative valuation" is the measure of your disagreement with the market. If the gap is small, you may not have a differentiated view. If the gap is large, you have either found an opportunity or made an error — and Phase 4 will help you determine which.
Step 4 — Sensitivity analysis
For each company, ask the agent: "Which single assumption, if changed by plus or minus 20%, moves the valuation the most?"
This is the most important output from the valuation phase. The answer tells you what you are actually betting on. If the valuation is most sensitive to revenue growth, you are making a growth bet. If it is most sensitive to the terminal growth rate, your valuation depends heavily on what happens after your explicit forecast period — which is another way of saying your valuation depends on a guess about the distant future.
Write down, for each company: "The valuation is most sensitive to __________, and I believe __________ about this assumption because __________."
This sentence is a core input to your thesis in Phase 5.
Phase 4 — Risk analysis and pre-mortem
Time estimate: 45 to 90 minutes across three companies. Agent roles: Red team (primary), Analyst (stress testing), Tutor (risk concepts). Chapter reference: Chapter 6 — Risk.
What you are doing
Shifting from "why this might work" to "how this might fail." This is the phase most people shortchange because it is psychologically unpleasant. By Phase 3, you have a valuation, a narrative, and a preliminary view. Attacking that view feels like attacking yourself. That instinct is exactly why this phase exists.
Step 1 — The four risk categories
For each company, assess the four real risks from Chapter 6:
Drawdown risk. How much could this stock fall from its current price in a bad scenario, and can you tolerate that decline without selling? This is not an abstract question. If you put 10% of your portfolio into a stock and it drops 40%, your portfolio drops 4%. Can you look at that loss for six months without panic-selling? If not, the position is too large for your psychology, regardless of what the valuation says.
Ask the agent (analyst role): "What is the maximum peak-to-trough drawdown this stock has experienced in the last ten years, and what caused it?" Then ask yourself: if that happened again, starting tomorrow, would you hold?
Fat-tail risk. What is the worst case — not the base-case downside, but the scenario where something fundamental breaks? Company fraud. Regulatory action that destroys the business model. A technological shift that makes the product obsolete. The characteristic of fat-tail events is that they are rare but devastating, and standard models systematically underestimate their probability.
Ask the agent (red team role): "Describe a realistic scenario in which this company loses more than 80% of its value within two years. What would have to happen?" The key word is "realistic" — not asteroid impact, but a plausible chain of events. The agent will generate scenarios. Your job is to assess which ones are dismissible and which ones keep you up at night.
Correlation risk. If you own three stocks and all three are correlated to the same factor — say, all three are technology companies sensitive to interest rates — a single macro event can hit all three simultaneously. Diversification that is only skin-deep (different tickers, same exposure) is not diversification at all.
Ask the agent: "What macroeconomic factor or industry trend would cause all three of my selected companies to decline simultaneously?" If the answer is obvious and significant, your three-company selection is less diversified than it appears. This is useful to know before Phase 6.
Liquidity risk. For large-cap stocks, this is rarely a concern — you can sell at any time. For smaller companies, particularly micro-caps or companies with low daily trading volume, the risk is that you cannot exit your position when you want to without moving the price against yourself. Ask the agent: "What is the average daily trading volume for this stock, and how does it compare to the position size I am considering?" If your position would take more than a few days of average volume to exit, liquidity risk is relevant.
Step 2 — Pre-mortem
This is the most valuable agent exercise in the entire workshop.
For each company, give the agent (red team role) the following prompt:
"It is 2030. I invested in [Company] in 2026. The investment lost 60% of its value and I sold at a loss. Write the post-mortem. What happened? Be specific — cite plausible events, market conditions, competitive developments, and management decisions that led to the failure. Do not include events that were unforeseeable in 2026 — only events that someone paying attention in 2026 could have anticipated as possibilities."
Read each pre-mortem carefully. For each scenario the agent describes, ask yourself three questions:
- Is this scenario plausible? Not "is it likely" — is it within the range of realistic outcomes?
- Would I see it coming? What signals would precede this scenario, and would I recognize them in time to act?
- Does my thesis from Phase 3 account for this? If the scenario describes a risk that my valuation implicitly assumes will not happen, that is a gap.
Write down, for each company, the pre-mortem scenario that disturbed you the most. Not the most dramatic one — the most plausible one. The one where you can see how it could actually unfold and you are not sure you would catch it in time.
Step 3 — Pushing past the agent's consensus
Here is where Chapter 6's trade-off paragraph becomes operational. The pre-mortem scenarios the agent generated are themselves likely to be consensus risks — the risks that every analyst is already aware of. The truly dangerous risks are the ones the agent does not think of, because they are not well-represented in its training data.
After reading the agent's pre-mortem, ask yourself: "What risk am I aware of from my circle of competence that the agent's scenarios did not include?" This is the value of doing the circle-of-competence exercise in Rule Zero. If you work in the company's industry, you may know about competitive threats, regulatory shifts, or customer behavior changes that are not yet in the consensus view. These are the risks that matter most, precisely because the market has not priced them in.
If you identify such a risk, add it to the pre-mortem. If you do not, that is also information — it means either the agent's coverage was thorough, or the company is outside the part of your circle where you have differentiated knowledge.
The sleep test
Howard Marks describes risk as "the probability of a loss you cannot afford." Not the probability of a loss. The probability of a loss you cannot afford. The distinction is critical.
After completing the pre-mortem for all three companies, ask yourself for each: "If the worst plausible scenario from my pre-mortem actually happened, and the position was sized at [whatever size you are considering], would I lose sleep?"
If yes, the position is too large. This is not a valuation question. It is a psychology question, and no amount of analysis changes the answer. Chapter 6 covered position sizing through the lens of Kelly criterion and fractional Kelly. The sleep test is the non-mathematical version of the same principle: your position size should be small enough that the worst plausible outcome does not compromise your ability to think clearly about your other positions.
Phase 5 — Thesis writing and red team
Time estimate: 60 to 90 minutes across three companies. Agent roles: Red team (attack), Tutor (thesis structure), Analyst (supporting data). Chapter reference: Chapter 7 — Write It Down or It Isn't a Thesis.
What you are doing
Converting your analysis from Phases 1 through 4 into a written thesis for each company, then stress-testing each thesis through the red-team protocol from Chapter 7. A thesis is not a summary of your analysis. It is a specific, falsifiable claim about the company's future, with conditions under which you would change your mind.
Step 1 — Write the thesis
For each company, write a thesis that includes the six elements from Chapter 7:
1. Catalyst. Why now? What specific development — a product launch, a margin inflection, a competitive shift, a valuation dislocation — makes this company interesting at this particular moment? "It's a good company" is not a catalyst. "The market is pricing in zero margin expansion, but my Phase 2 analysis shows three consecutive quarters of improving gross margins driven by a shift to higher-value products" is a catalyst.
2. Moat. What protects this company from competition? Switching costs, network effects, cost advantages, brand, regulatory barriers. Be specific about which type and be honest about how durable it is. Many apparent moats are eroding. If the moat is weakening, your thesis needs to account for that.
3. Management. Are the people running this company competent and aligned with shareholders? This is hard to assess from outside, but it is not impossible. Look at capital allocation history (from your Phase 2 cash flow analysis). Look at insider ownership. Look at whether management has delivered on previous guidance. Ask the agent (analyst role) for a summary of the CEO's track record — previous companies, tenure, alignment signals.
4. Valuation frame. Based on your Phase 3 work, at what price range does this company represent value? This is not a single number. It is a range: "I believe the company is worth between $X and $Y per share, with $Z being my base case, which implies [upside/downside] from the current price of $W." Explicitly state which assumption drives the range — this is the sensitivity analysis output from Phase 3, Step 4.
5. Kill switches. Under what specific, observable conditions would you abandon this thesis? These must be concrete enough to act on. "If the company's fundamentals deteriorate" is not a kill switch. "If gross margins drop below 30% for two consecutive quarters, I will reassess because my thesis depends on margin expansion" is a kill switch. Write at least two kill switches per company.
6. Time horizon. How long are you willing to wait for the thesis to play out? A turnaround thesis might need three years. A near-term catalyst thesis might need six months. If the thesis has not played out within your time horizon, that is itself a signal — either your thesis was wrong, your timing was wrong, or conditions changed in ways that require a new version.
The thesis for each company should be 200 to 400 words. Write it in your own words. Not bullet points — connected prose. The discipline of writing forces you to confront gaps in your reasoning that bullet points let you skip over.
Step 2 — Red team
For each thesis, give it to the agent in red team role with the following prompt:
"You are a short seller who believes [Company] is a bad investment. Here is my thesis: [paste your thesis]. Give me your three strongest attacks — the three most compelling reasons my thesis is wrong. Be specific. Cite data. Do not be polite."
Read the attacks. For each one, determine:
- Attack lands. The attack identifies a real weakness in your thesis that you did not adequately address. You need to either revise the thesis to account for this or accept it as a known risk.
- Attack misses. The attack is based on a misunderstanding of the company, stale data, or a generic concern that is not specific to your thesis. Explain why it misses.
- Attack is interesting but uncertain. The attack raises a possibility you had not considered, but you do not have enough information to determine whether it is valid. This goes on your "monitor" list.
Step 3 — Iterate until the attacks miss
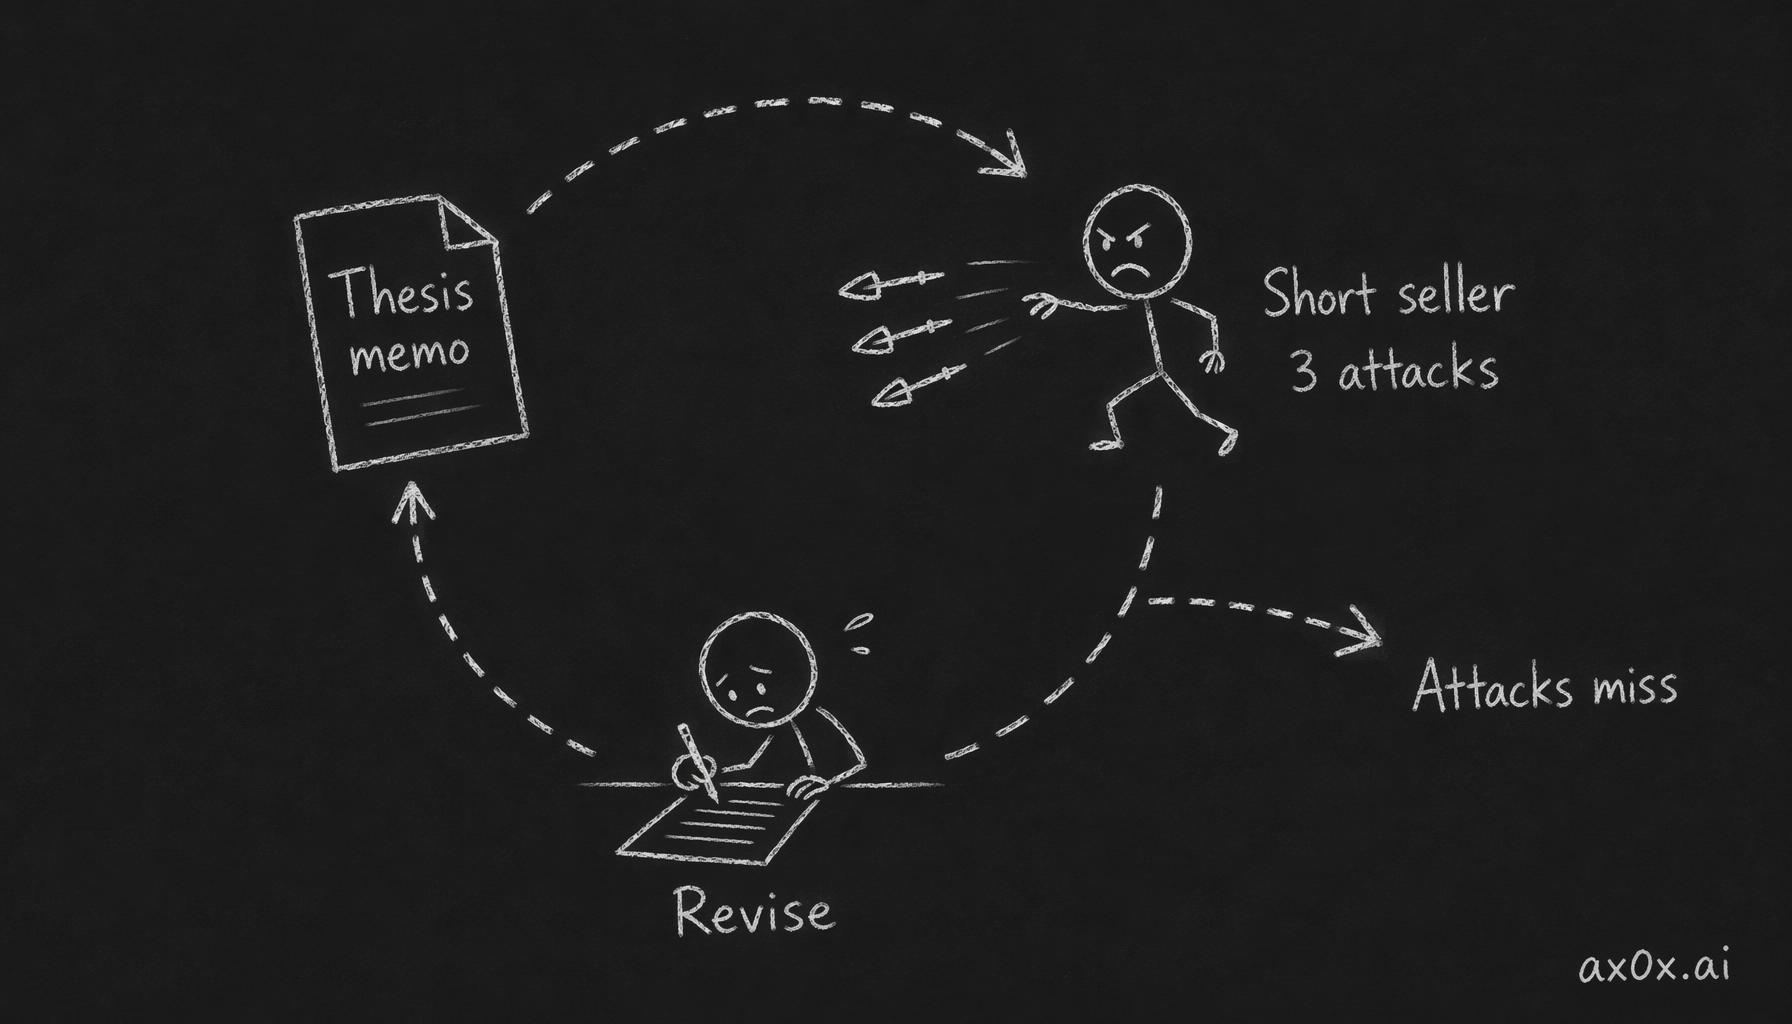 Hand the thesis to a short-seller, absorb attacks and revise each round, looping until the attacks miss.
Revise your thesis based on the attacks that landed. Then send the revised version back to the agent: "Here is my revised thesis. Find three new attacks that are different from the previous ones."
Repeat until the agent's attacks consistently miss or repeat earlier attacks in different language. This usually takes two to three rounds. If it takes more than four rounds and the attacks are still landing, your thesis may have a fundamental problem that iteration cannot fix. That is a signal to seriously consider "skip" as the outcome for this company.
Step 4 — Version stamp
Save each final thesis with today's date and a version number (v1.0). This is the baseline. If you decide to invest, you will revisit this thesis periodically and compare reality against what you wrote. Chapter 7 explained why this matters: your memory of "why I invested" will drift over time to match what you wish you had thought. The written thesis is your anchor against that drift.
Phase 6 — Decision
Time estimate: 30 to 60 minutes. Ideally after sleeping on it. Agent roles: None. This phase is yours alone. Chapter reference: Chapter 1 — The Barrier Changed (judgment is the bottleneck), Chapter 7 — Thesis (discipline).
What you are doing
Making a decision. One of three outcomes for each company: buy, skip, or revisit later. Then choosing: of the companies you would buy, which one, and at what position size?
The rule for this phase
No agents. This is the most important rule in the workshop. The decision is yours. The previous five phases used agents extensively to gather data, compute valuations, and stress-test your reasoning. The decision itself cannot be delegated — not because agents are incapable of producing a recommendation, but because a recommendation you did not arrive at yourself is a recommendation you will not have the conviction to hold through adversity.
This is the Chapter 1 principle in action: agents removed the barrier to analysis, but the barrier to judgment was always you. Phase 6 is where that barrier stands or falls.
Decision framework
Lay out your three thesis documents side by side. For each company, answer these five questions in writing:
1. Do I believe my own thesis? Not "does the analysis support it" — do you believe it? There is a difference between an analysis that is logically sound and a thesis you have conviction in. If the analysis says the company is undervalued but something in your gut says the situation is more complicated than your model captures, pay attention to that. It might be noise. It might be the pattern recognition from your circle of competence detecting something your formal analysis missed.
2. Is the upside sufficient to justify the risk? Compare your base-case valuation from Phase 3 against the pre-mortem scenarios from Phase 4. If the base case offers 30% upside but the worst plausible case involves a 60% loss, the risk-reward is asymmetric in the wrong direction — unless you believe the probability of the downside scenario is very low. Be explicit about that probability estimate.
3. What is the strongest remaining attack against this thesis? After Phase 5's red-team process, what is the one argument that still has not been fully resolved? If you cannot identify it, you may not have stress-tested thoroughly enough.
4. Does this company pass the sleep test at the position size I am considering? From Phase 4. If the answer is "only if I reduce the position size to something trivially small," that is telling you something about your actual conviction level.
5. Would I be comfortable explaining this investment to a skeptical but intelligent friend? Not a bull case. Not a pitch. An honest explanation that includes the risks, the uncertainties, and the conditions under which you would be wrong. If you cannot produce that explanation comfortably, the position is not ready.
Making the call
After answering the five questions for all three companies, choose one of the following:
Buy one. You have identified one company where your thesis is strong, the risk-reward is favorable, the red-team attacks have been addressed, and you have conviction. Specify the position size and the time horizon.
Skip all three. None of the three companies met your bar. Your capital stays where it is. This is a valid, respectable outcome. Buffett has said that the ability to say "no" is the most important investing skill. Most pitches should be declined, and that is doubly true when you are building your framework for the first time. If none of your three companies produced a thesis you are willing to defend with money, the correct action is to wait.
Revisit one later. One company was close but not ready — maybe the valuation is not quite there at the current price, or a key uncertainty needs more time to resolve. Mark it for revisit with a specific trigger: "Revisit if the stock price drops below $X" or "Revisit after Q2 earnings to see if the margin trend I identified continues."
Write your decision in one paragraph. Include the company name (or "none"), the position size (or "zero"), the time horizon, and the single most important reason for the decision.
Phase 7 — Memo and review date
Time estimate: 30 to 45 minutes. Agent roles: Executor (formatting only). Chapter reference: Chapter 7 — Thesis (version control), Chapter 8 — Agent Fleet (documentation).
What you are doing
Assembling everything from Phases 1 through 6 into a single investment memo per company, setting a review date, and documenting the process itself. This is the final deliverable of the capstone.
Memo structure
For each of the three companies, compile a memo with the following sections. You can ask an agent (executor role) to format and organize, but the content comes from your earlier phases — do not generate new analysis here.
Company overview. Two to three sentences: what the company does, what sector it operates in, and why it is in your circle of competence.
Data summary. The key financial metrics from Phase 1, in a clean table. Revenue, margins, debt, free cash flow — the verified numbers.
Three-lens assessment. Your three paragraphs from Phase 2 — business structure, fragility, and cash flow truth.
Valuation. Your base case, your adjusted narrative case, and the sensitivity analysis result from Phase 3. What is the stock worth under your assumptions? What is the key assumption that drives the number?
Risk assessment. The pre-mortem scenario that concerned you most from Phase 4. The four-risk assessment. The sleep-test result.
Thesis. Your final version from Phase 5 — the 200-to-400-word thesis with all six elements.
Decision. Your one paragraph from Phase 6.
Kill switches. Listed explicitly. These are the conditions under which you will re-evaluate.
Review date. When will you reopen this memo and compare reality to your thesis? For most positions, quarterly — after each earnings report. For "revisit later" decisions, the specific trigger date or event you identified.
Save the memo
Save each memo with the date, the company name, and version 1.0 in the filename. These documents are your investment journal. They serve two purposes:
First, they are accountability tools. When you reopen them at the review date, you will compare what you wrote with what actually happened. Did the margins expand as your thesis predicted? Did the kill switch trigger? Did the pre-mortem scenario begin to unfold? This comparison is how you calibrate your judgment over time — not by tracking whether the stock went up or down (which is partly luck), but by tracking whether your specific predictions about the business were correct.
Second, they are baseline documents for Chapter 7's thesis version control. If conditions change and you revise your thesis, the new version goes into a v1.1 memo that explicitly states what changed and why. The chain of versions is your track record — not of returns, but of reasoning.
Process documentation
Separately from the three memos, write a short process document (one page or less) answering:
- What worked in my process? Which phases produced useful insights? Where did the agent fleet add the most value?
- What did not work? Where did I get stuck? Where did I accept agent output without questioning it and later wished I had pushed back?
- What would I do differently next time? This is the most important question. Your process will improve faster if you document the friction points while they are fresh.
- How long did each phase actually take? Compare to the estimates at the top of each phase. This calibrates your time expectations for future research.
This process document is the beginning of your personal research framework. It will evolve as you repeat the workflow for new companies. Over time, it becomes the most valuable document you own — more valuable than any individual investment memo, because it captures how you learn, not just what you concluded.
Reflection
You have now completed the full pipeline: circle of competence, data verification, three-lens reading, valuation with your own narrative, risk analysis with pre-mortem, thesis with red team, decision, and documented memo.
Step back from the specific companies and consider these questions. They do not have right answers. They have useful answers — answers that will shape how you approach the next round of analysis.
1. Where did the agent add the most value, and where did it add the least?
For most people, the answer is: agents added enormous value in data gathering (Phase 1) and computation (Phase 3), moderate value in red-teaming (Phase 5), and almost no value in the decision itself (Phase 6). If that matches your experience, it is consistent with the Chapter 1 thesis — agents removed the production bottleneck, and what remains is judgment.
If the agent added significant value in red-teaming, that is a good sign — it means you are using the red-team role effectively and the attacks genuinely changed your thinking. If the agent's red-team attacks felt generic and unhelpful, revisit Chapter 2 on how to frame requests for the red-team role, and consider whether your prompts were specific enough to elicit non-consensus attacks.
2. Where did your circle of competence actually matter?
Look back at the phases where you disagreed with the agent's output or caught something the agent missed. Were those moments concentrated in the industry you know best? If so, your circle of competence is functioning — your domain knowledge is generating differentiated insights. If not, either your circle is narrower than you thought, or you are not yet skilled at translating domain knowledge into financial analysis. Both are addressable.
3. How did your conviction change across phases?
Track the arc. Many people start with moderate interest in a company, build conviction through Phases 2 and 3 as the analysis comes together, and then lose some conviction in Phases 4 and 5 as the risks and red-team attacks accumulate. That arc is healthy. If your conviction only increased throughout the process, the red-team phase probably did not work — you were confirming rather than testing.
The ideal pattern is: interest → growing conviction → shaken conviction → rebuilt conviction on firmer ground. If you ended Phase 5 with the same thesis you started Phase 3 with, you either had a very good thesis to begin with or you were not pushing the red team hard enough.
4. Would you repeat this process?
The honest answer, for most people the first time through, is: "Yes, but not exactly like this." The phases are right. The sequence is right. But your specific execution — how long you spent on each phase, how many questions you asked the agent, which metrics you focused on — will be different next time because you now know where the leverage is.
That adaptation is the point. The seven-phase structure is a scaffold. Your personal framework is what grows around it. The first time is the slowest. By the third or fourth company, the phases will feel natural, the agent interactions will be more focused, and the memos will be sharper. Not because the process gets easier — it should not — but because your judgment about where to spend time improves.
5. What are you going to do with the memos?
If you made a "buy" decision, the memo is now a live document. Put the review date on your calendar. When that date arrives, reopen the memo and compare every prediction to reality. Not the stock price — the business fundamentals. Did margins move as you expected? Did the risk scenario you feared begin to materialize? Did your kill switches trigger?
If you made a "skip" decision, the memo is still valuable. When one of these companies shows up in your research again — and it will, if it is in your circle of competence — you will have a documented baseline for what you thought and why. You will be able to see whether conditions have changed enough to warrant a different conclusion.
If you made a "revisit" decision, set the trigger. Not a vague "I'll look at it later," but a specific condition: a price level, an earnings report, a product launch. When the trigger fires, reopen the memo and update it — new data into Phase 1, new analysis through Phases 2-5, new decision in Phase 6, new version stamp.
What comes next
Chapter 10 closes the curriculum. It is not a workshop. It is a reflection on what you have built through nine chapters and what compounds from here. The final exercise is the only one in the series that you do without an agent.
The capstone you just completed is not a one-time exercise. It is a repeatable workflow. The first time takes the longest. Each subsequent pass gets more efficient — not because you cut corners, but because your judgment about where to focus improves. The memos accumulate. The process documents improve. The circle of competence widens, slowly, as you learn from the gap between your predictions and reality.
Buffett has been doing a version of this for seven decades. The companies changed. The tools changed. The core loop — understand the business, value it honestly, assess the risk, write down your thesis, hold yourself accountable to what you wrote — did not.
Your agent fleet can now handle the first half of that loop at a speed and cost that Buffett's generation could not have imagined. The second half — the judgment, the discipline, the willingness to say "not this one" — is the same as it always was. That is the part that compounds.
Chapter 10 asks a different question: not how to invest, but what kind of investor you are becoming. It is the only chapter in the series where the workshop requires no agent at all.