Risk Isn't Volatility
Chapter 6 of 10 in the AI-Native Investor curriculum.
In September 1998, Long-Term Capital Management — a hedge fund run by two Nobel laureates in economics, a former Federal Reserve vice-chairman, and some of the most sophisticated quantitative traders on the planet — lost $4.6 billion in less than four months. At its peak, LTCM managed $4.7 billion in equity and controlled positions worth over $125 billion, with off-balance-sheet derivatives exposure exceeding $1.25 trillion notional. The fund's models, built on decades of historical data and the best available financial theory, said the trades were safe. The models measured risk as volatility. They were catastrophically wrong.
This is not a story about smart people being dumb. It is a story about what happens when a precise-sounding definition of risk replaces actual thinking about what can go wrong.
Every financial model you will encounter — whether you build it yourself or have an agent build it for you — carries an implicit definition of risk. That definition is almost always some variation of volatility: standard deviation of returns, value-at-risk, beta, Sharpe ratio. These measures are useful in normal markets. They are useless — or worse, actively misleading — in the moments when risk matters most.
This chapter teaches you to think about risk differently: not as a statistical property of a security, but as the probability of a loss you personally cannot afford.
What this chapter covers
- LTCM: a detailed autopsy of the most instructive blowup in modern finance
- Why volatility is a terrible proxy for risk
- Four risks that actually matter
- Position sizing: the Kelly criterion and the sleep test
- The pre-mortem technique: your agent's best risk job
- What agents do well vs. what only you decide
- Workshop: the 2030 post-mortem
1. LTCM: a detailed autopsy of the most instructive blowup in modern finance
Long-Term Capital Management is the most important case study in risk management not because it was the largest loss, but because the people involved did everything that conventional risk theory said was correct — and it still destroyed them.
The setup
John Meriwether founded LTCM in 1994. His team included Myron Scholes and Robert Merton, who would share the 1997 Nobel Prize in Economics for their work on options pricing theory — the very theory the fund used to identify mispricings. David Mullins, former vice-chairman of the Federal Reserve, joined as a partner. The team was, by any reasonable measure, the most credentialed group of risk managers ever assembled in one fund.
Their strategy was convergence arbitrage: find two securities that should, by mathematical relationships, trade at nearly identical prices, then bet on the gap closing. U.S. Treasury bonds of slightly different maturities. Corporate bonds versus government bonds of the same duration. European sovereign bonds converging ahead of the euro's introduction. Each individual trade had a small expected profit and, according to the models, a tiny probability of loss. The key assumption was that the trades were uncorrelated — if one went wrong, the others would not go wrong at the same time.
For the first four years, this worked beautifully. LTCM returned 21% in 1995, 43% in 1996, and 41% in 1997 — after fees of 25% of profits plus 2% of assets. Investors were so eager to get in that the fund returned $2.7 billion of capital to outside investors in 1997, keeping the best trades for the partners' own money.
The models
LTCM's risk models were state-of-the-art. They used value-at-risk (VaR), which estimated the maximum loss the portfolio would experience on 95% or 99% of trading days. They computed correlations between every pair of positions using years of historical data. They stress-tested against historical scenarios, including the 1987 crash. The models said the fund could lose at most a few hundred million dollars in a worst-case month. The probability of losing the entire fund was, according to the models, effectively zero — a multi-sigma event that should occur less than once in the lifetime of the universe.
Here is what the models assumed:
Correlations are stable. If U.S. Treasury arbitrage and European sovereign arbitrage were uncorrelated over the past five years, they would be uncorrelated going forward.
Liquidity is continuous. The fund could exit any position at something close to the current market price.
The past predicts the distributional shape of the future. If bond spread movements followed a roughly normal distribution for the past decade, they would continue to do so.
Every one of these assumptions was reasonable based on the available data. Every one of them turned out to be wrong at the same time.
The collapse
On August 17, 1998, Russia defaulted on its government debt and devalued the ruble. This was not, in itself, a large event for LTCM — the fund had limited direct Russian exposure. But the default triggered something the models had no way to predict: a global flight to quality. Every investor in the world simultaneously decided they wanted U.S. Treasuries and wanted to sell everything else.
The correlations that LTCM's models had measured over years of calm markets — the uncorrelatedness between different convergence trades — vanished overnight. Every spread the fund was betting would narrow instead widened. Simultaneously. In every market. The reason was not that anything had changed about the fundamental relationships between the securities. The reason was that every leveraged investor was trying to reduce risk at the same time, and they were all in the same trades.
LTCM lost $550 million on August 21 alone. By the end of August, the fund had lost $1.85 billion — roughly 44% of its equity. The positions were still "right" in the sense that the convergences eventually happened. But the fund could not survive long enough to see them happen, because the losses triggered margin calls, which required the fund to sell positions, which pushed prices further against it, which triggered more margin calls. This is the death spiral that leverage creates.
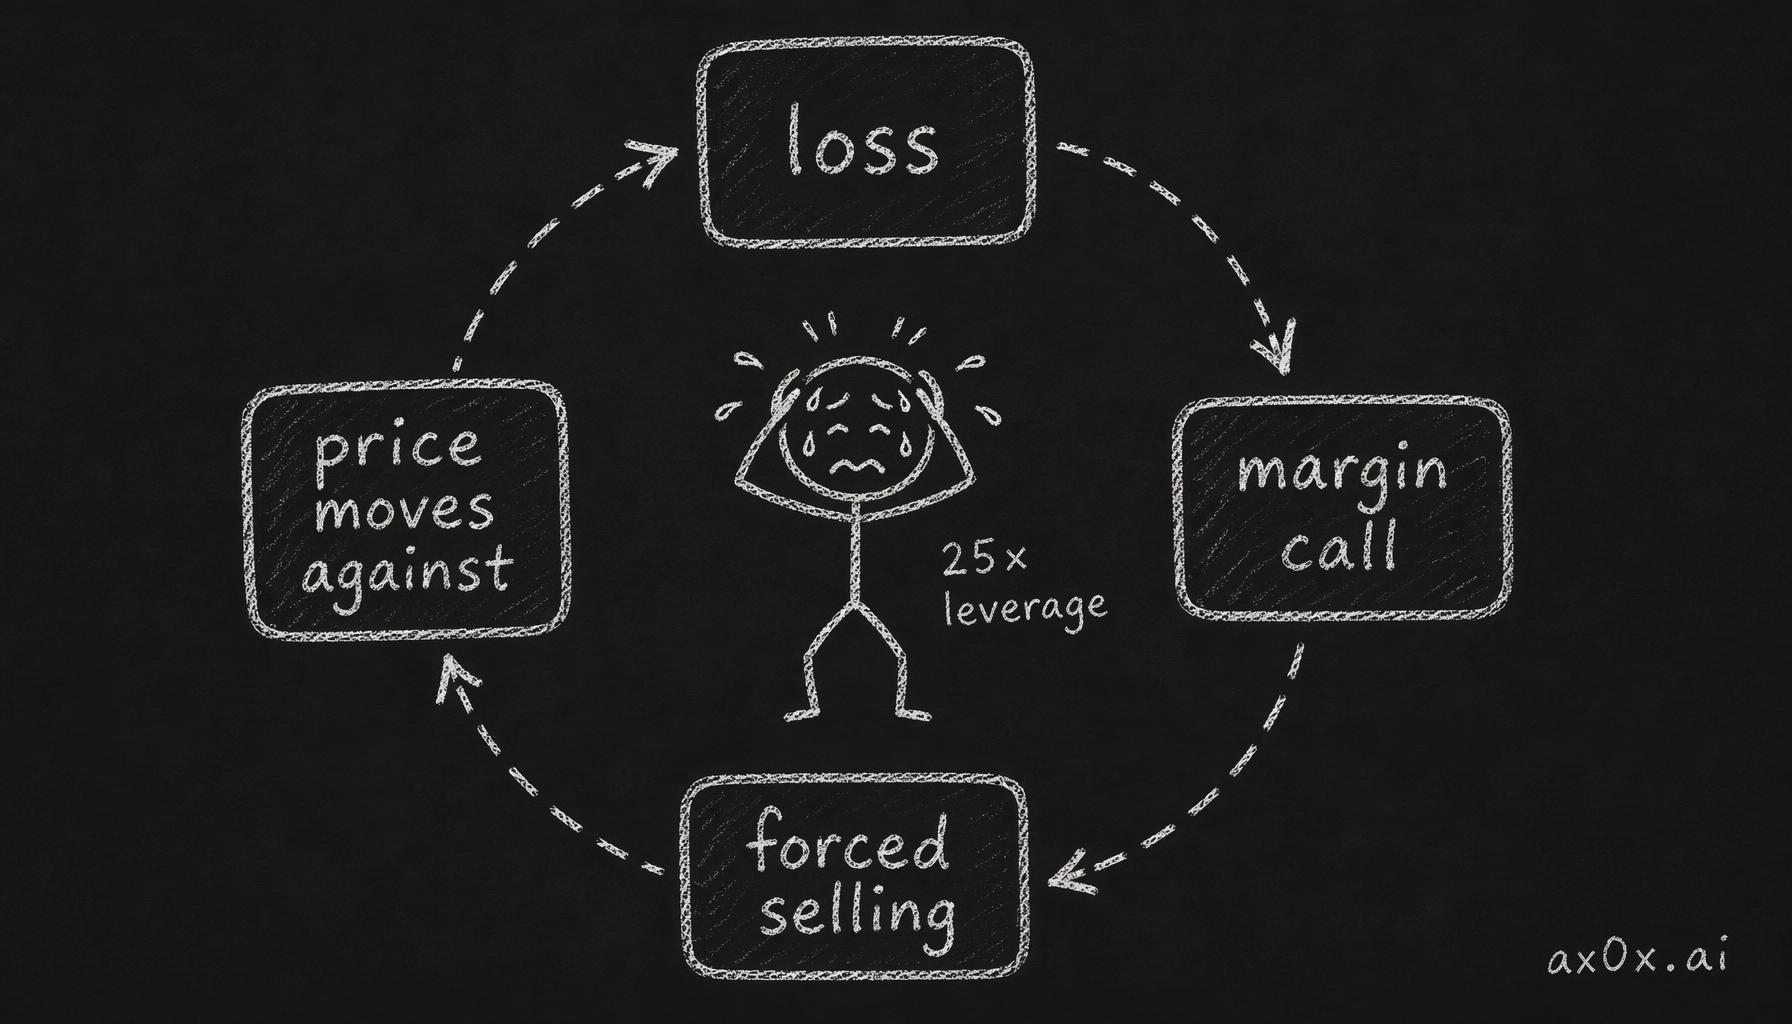 The leverage death spiral: a loss triggers a margin call, forcing selling, which pushes prices against you and feeds a bigger loss
By September, the fund's equity was down to $600 million — supporting a balance sheet that still held over $100 billion in positions. The leverage ratio had ballooned from roughly 25:1 to over 167:1. At this level, a price move of less than 1% in the wrong direction would have wiped out the remaining equity entirely.
The Federal Reserve Bank of New York organized a $3.65 billion bailout by fourteen Wall Street banks — not because they cared about LTCM's partners losing money, but because LTCM's positions were so large and intertwined with the rest of the financial system that a disorderly unwind could have triggered a cascading failure across global credit markets.
What the autopsy reveals
The lesson of LTCM is not "leverage is dangerous." That is true but obvious. The deeper lesson is about what risk measurement can and cannot do.
Correlation is not a property of securities. It is a property of market conditions. In calm markets, different arbitrage strategies are uncorrelated because different investors with different strategies are active. In a crisis, there is only one strategy — sell everything and buy safety — and every asset becomes correlated with every other asset. LTCM's models measured correlation during calm periods and extrapolated it into crisis periods. This is like measuring the structural integrity of a bridge on a sunny day and concluding it will hold in an earthquake.
Volatility measures the frequency and size of normal moves. It says nothing about the moves that destroy you. LTCM's value-at-risk model worked perfectly on 99% of trading days. The problem was that the 1% of days the model explicitly excluded were the only days that mattered.
Liquidity disappears precisely when you need it most. In normal markets, LTCM could exit a billion-dollar position in a day. In August 1998, every bank in the world knew LTCM was in trouble, knew exactly which positions LTCM held (because the banks were the counterparties), and had no incentive to offer a fair price. Liquidity is not a constant. It is a fair-weather friend.
The map is not the territory. LTCM's models were mathematically elegant and internally consistent. They were also built on assumptions about how markets work during normal times and applied to decisions about how much risk to take for all times, including the abnormal ones. The model became the reality for the people inside it. They stopped asking "what if the model is wrong?" and started asking only "what does the model say?" — a subtle but fatal shift.
Nassim Taleb, who was trading options during the LTCM crisis and profited from the very kind of blowup LTCM suffered, later formalized this critique. The core argument, developed across Fooled by Randomness, The Black Swan, and Antifragile: any risk model that relies on historical data to predict future distributions will systematically underestimate the probability and severity of extreme events. The past contains only the extremes that have already happened. It tells you nothing about the extremes that have not happened yet.
The trade-off in learning from LTCM
There is a real risk of over-learning from this case study. LTCM's failure does not mean all quantitative risk management is useless, or that leverage always kills, or that models should be abandoned. LTCM's specific failure mode — massive leverage on correlated convergence trades with assumed continuous liquidity — is a particular kind of fragility, not a universal one.
The correct lesson is narrower and more useful: risk models tell you about normal variation. They do not tell you about the events that will actually hurt you. Those events are, almost by definition, the ones the model does not capture, because they arise from conditions the historical data does not contain. This means risk management cannot be fully outsourced to a model — or to an agent running a model. It requires judgment about scenarios the model cannot imagine.
2. Why volatility is a terrible proxy for risk
The finance industry's standard definition of risk is volatility — the standard deviation of returns. A stock that moves up and down a lot is "risky." A stock that moves gradually is "safe." This definition is baked into nearly every tool you will use: Sharpe ratios, beta, value-at-risk, risk-adjusted return. When your agent computes risk metrics, it is almost certainly computing some flavor of volatility.
The definition has one enormous advantage: it is computable. Given a time series of prices, you can calculate standard deviation in seconds. It is precise, objective, and comparable across assets. These properties make it irresistible for anyone building models or ranking investments.
It also has two fatal flaws.
Flaw one: it penalizes upside movement
Volatility is symmetric. A stock that goes up 5% per day has the same volatility as a stock that goes down 5% per day. In the volatility framework, both are equally "risky." But no investor in history has complained about a stock that went up 5% per day. The risk they care about is on the downside. Upside volatility is not risk. It is the entire point of investing.
Taleb made this argument most forcefully: the distribution of returns matters far more than the standard deviation. A strategy that produces small, steady gains and occasional catastrophic losses has low volatility most of the time and looks "safe" by standard metrics — right up until it destroys you. A strategy that produces volatile gains with limited downside has high measured volatility and looks "risky" — but it cannot kill you. LTCM was the first type. Taleb's own trading strategy, buying out-of-the-money options, was the second type.
The phrase Taleb uses — and it is the most useful mental model in this chapter — is "picking up pennies in front of a steamroller." Strategies that harvest small, consistent returns by selling insurance against rare events look brilliant in 99 out of 100 periods. In the hundredth period, they blow up. The volatility measurement covers the 99 periods and misses the one that matters.
Flaw two: it assumes returns are normally distributed
Standard deviation is most meaningful when the underlying data follows a normal (Gaussian) distribution — the classic bell curve. In a normal distribution, extreme events are vanishingly unlikely. A move of three standard deviations from the mean should happen about 0.3% of the time. A five-sigma event should happen once every 14,000 years. A ten-sigma event should happen roughly once in the lifetime of the universe.
Financial returns are not normally distributed. They have "fat tails" — extreme events happen far more often than a normal distribution predicts. The 1987 crash was a 20+ sigma event under normal distribution assumptions. The August 1998 moves that killed LTCM were multi-sigma events. The March 2020 COVID crash saw moves that models estimated should happen once per millennium.
This is not a minor technical quibble. If your risk model assumes normally distributed returns, it will tell you that a 30% drawdown in a month is essentially impossible. In practice, 30% monthly drawdowns have happened multiple times in living memory. If you size your positions based on the model's assurance that such moves "cannot" happen, you will eventually encounter one, and the position will be too large to survive.
What to use instead
Howard Marks offers what may be the most practical alternative definition: "Risk is the probability of a bad outcome, and the severity of that outcome if it occurs."
This definition has no formula. It cannot be computed from a time series. That is precisely its strength — it forces you to think rather than calculate.
When Marks evaluates risk, he asks: what is the range of possible outcomes? What is the probability of each? What is the worst case, and can I survive it? This framing puts the question where it belongs — on you, the person whose money is at stake — rather than on a statistical property of the asset.
Buffett's formulation is even simpler: "Rule number one: don't lose money. Rule number two: don't forget rule number one." The pithy phrasing obscures a serious point. Buffett does not mean "never have a losing trade." He means: never take a position where the downside — even in a scenario you consider unlikely — would permanently impair your ability to keep investing. A 50% drawdown requires a 100% return to recover. A 90% drawdown requires a 900% return. The math of recovery is asymmetric and brutal, and no amount of expected return compensates for a loss that takes you out of the game entirely.
The trade-off in abandoning volatility
If you stop using volatility as your risk measure, you lose the ability to make precise, quantitative comparisons. "Stock A is riskier than Stock B because its standard deviation is higher" is a clean, defensible statement. "Stock A is riskier than Stock B because I think its downside scenarios are worse" is a judgment call that two reasonable people can disagree about.
This is real. Volatility-based risk measures are worse than nothing only when they are treated as the final answer. As one input among many — as a description of normal variation, clearly labeled as such — they are perfectly fine. The problem is when a Sharpe ratio becomes the reason you hold a position, when a low-beta label makes you forget to think about what would actually happen to the stock in a crisis.
Your agent will compute volatility-based risk metrics faster and more accurately than you ever could. Let it. Then ask the question no volatility metric can answer: if this position goes against me in ways the historical data does not contain, what happens to my portfolio and my ability to keep investing?
3. Four risks that actually matter
If volatility is a poor proxy, what should you actually worry about? Four risks cover the majority of ways individual investors suffer losses they cannot recover from. Each has a specific mechanism, a historical case, and a practical response.
Risk 1: Drawdown depth — losses that change the math
A 10% loss requires an 11% gain to recover. A 30% loss requires a 43% gain. A 50% loss requires a 100% gain. A 70% loss requires a 233% gain. The relationship is not linear — it is exponential, and it works against you with increasing cruelty as the drawdown deepens.
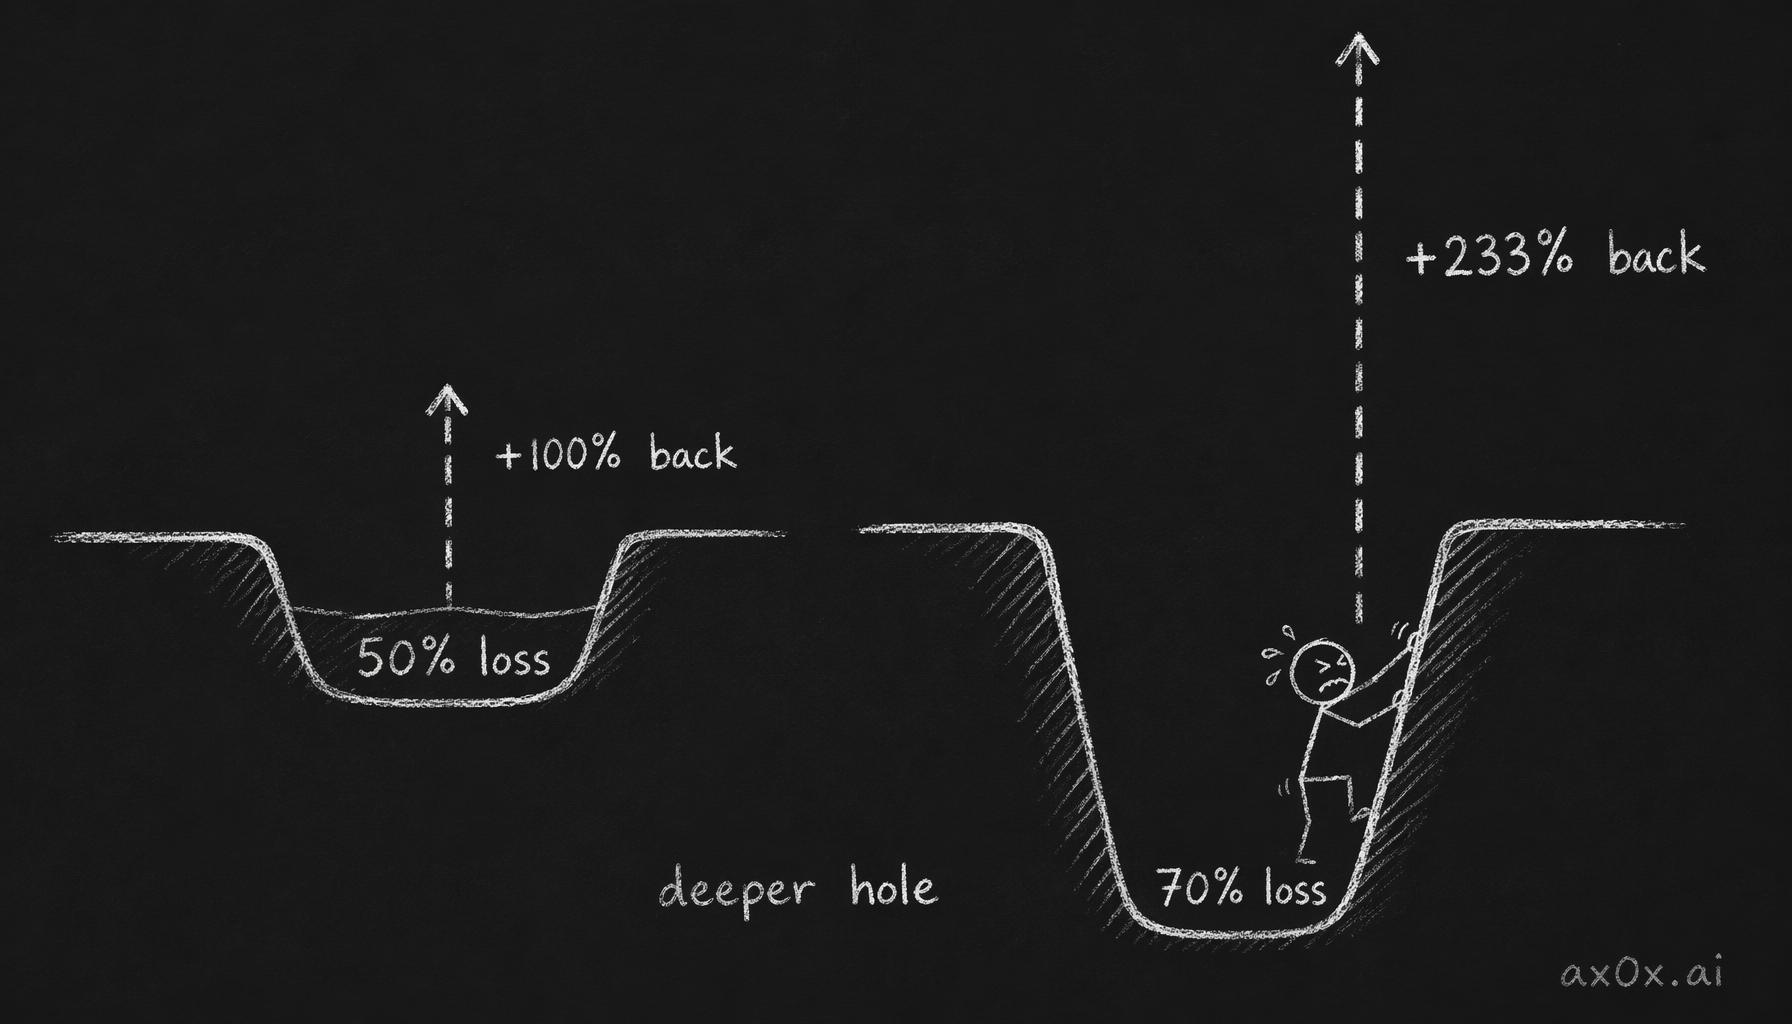 The asymmetric math of recovery: the deeper the loss, the exponentially larger the gain needed to break even — down 50% needs +100%, down 70% needs +233%
This is not a psychological problem. It is an arithmetic one. A portfolio that loses 50% and then gains 50% is not back to even. It is at 75% of where it started. The deeper the hole, the more improbable the climb out — not because the market is hostile, but because percentages compound asymmetrically.
Case: Cisco, 2000-2015. Cisco hit $77 per share in March 2000 at the peak of the dot-com bubble. By October 2002, it had fallen to $8.60 — a 89% drawdown. Cisco was not a fraud. It was a real company with real revenue and real customers. It still is. But in early 2026, the stock trades around $60. An investor who bought at the peak in 2000 waited 26 years and is still underwater. The business recovered. The stock price, for the peak buyer, did not — because the drawdown was so deep that even decades of growth could not close the gap.
Practical response. Before you take any position, calculate what a 50% drawdown in that specific holding would do to your total portfolio. If the answer makes you uncomfortable — not as an abstract exercise but as a real number — the position is too large. This is the most basic form of risk management and it requires no model, no agent, no formula. It requires multiplication and honesty.
Risk 2: Fat tails — the events that "cannot" happen
In a normally distributed world, daily moves of more than three standard deviations would happen roughly once per year. In actual equity markets, they happen roughly once per month. Moves of more than five standard deviations would happen once every 14,000 years under a normal distribution. In practice, they happen roughly once per decade.
This is what Taleb calls "fat tails" — the extreme ends of the distribution are much thicker than standard models predict. The practical consequence: events that your risk model labels "virtually impossible" are, in fact, merely infrequent. And infrequent is very different from impossible.
Case: the Swiss franc, January 2015. On January 15, 2015, the Swiss National Bank unexpectedly removed the franc's peg to the euro. The franc appreciated roughly 30% against the euro in minutes — a move that no volatility model predicted, that no historical data contained (because the peg had been in place since 2011), and that destroyed multiple foreign exchange brokerages outright. FXCM, one of the largest retail forex brokers in the world, lost $225 million in a single morning and required an emergency bailout. Retail traders who were short the franc — a popular carry trade because the peg seemed "guaranteed" — had their accounts wiped out and in some cases owed their brokers money beyond their deposits.
The Swiss franc peg had held for three and a half years. Volatility in the EUR/CHF pair was among the lowest in the forex market. By every standard risk metric, it was one of the "safest" trades available. The safety was an illusion created by the peg — and the peg was a policy decision that could be reversed by a small group of people in a room in Bern.
Practical response. For any position, ask: "Is there a scenario — political, regulatory, technological, natural — in which this asset loses 50% or more in a single day?" If the answer is yes, the position must be sized for that scenario, not for the normal variation the data shows. If you cannot think of such a scenario, it means you have not thought hard enough, not that one does not exist.
Risk 3: Correlation breakdown — diversification fails when you need it most
The standard portfolio construction advice — diversify across asset classes, sectors, and geographies — is based on the assumption that different assets behave independently enough that losses in one are offset by stability or gains in another. This is true in normal markets and false in crisis markets.
In 2008, the Global Financial Crisis produced simultaneous drawdowns across U.S. equities, international equities, high-yield bonds, real estate, commodities, and most emerging markets. An investor who believed they were diversified because they held all of these asset classes discovered that in a genuine liquidity crisis, nearly every asset except U.S. Treasuries and cash moved in the same direction — down.
The mechanism is the same one that killed LTCM: in a crisis, the dominant behavior is selling anything risky and buying safety. It does not matter that your stocks are in different sectors or your bonds are in different countries. If they are all "risk assets," they will all decline together when the global risk appetite collapses.
Case: the "diversified" 60/40 portfolio in 2022. The 60% stock / 40% bond portfolio is the canonical conservative allocation. Its premise: when stocks fall, bonds rise, providing a cushion. In 2022, the Federal Reserve's aggressive rate hikes caused stocks and bonds to fall simultaneously. The S&P 500 fell roughly 19%. The Bloomberg U.S. Aggregate Bond Index fell roughly 13%. The "balanced" portfolio lost on both sides — something the model said was highly unlikely based on the negative correlation between stocks and bonds that had persisted for over two decades.
The stock-bond correlation had been negative since roughly 2000. Before that — from the 1970s through the late 1990s — it was positive, meaning stocks and bonds moved together. The negative correlation was not a law of nature. It was a product of a specific macroeconomic regime (falling interest rates, low inflation). When that regime ended, the correlation regime ended with it.
Practical response. Diversification reduces risk in normal markets. It does not protect against the specific scenarios that destroy portfolios. For that, you need a different kind of protection: position sizing that assumes your diversification will fail at the worst possible moment, and enough cash or genuinely uncorrelated assets (which are far fewer than most people assume) to survive the correlated drawdown.
Risk 4: Liquidity — the exit that disappears
Liquidity means the ability to sell an asset at or near its current market price. In liquid markets (large-cap U.S. equities, major currency pairs, U.S. Treasuries), you can sell a reasonable-sized position in seconds with minimal price impact. In less liquid markets (small-cap stocks, corporate bonds, private investments, certain ETFs), selling can take days and the price you receive may be substantially worse than the quote you saw on screen.
The danger is that liquidity is invisible until it is gone. A stock that trades millions of shares per day in normal markets may trade a fraction of that when the market is stressed and everyone is trying to sell simultaneously. The quoted price is not the price you will get — it is the price of the last trade, which may have happened under completely different conditions.
Case: the ETF flash crash, August 2015. On August 24, 2015, during a period of market stress related to Chinese economic concerns, several major ETFs — including some that tracked the S&P 500 — traded at discounts of 20% or more to their underlying net asset value. An investor who owned the iShares Core S&P 500 ETF (IVV) saw the price drop to levels that implied the S&P 500 had fallen 35%, when in reality it had fallen roughly 5%. The ETF's market-making mechanism had broken down because the underlying stocks had not yet opened or were halted. The "price" on the screen was not a real price — it was the panic bid in a market with no sellers willing to offer a fair one.
Most investors who sold during those minutes locked in losses that were entirely artificial — the ETF was back to its correct price within hours. But for anyone with a stop-loss order that triggered during the chaos, the loss was real and permanent.
Practical response. Never assume you can exit a position at the current price under stress. For any position — but especially for less liquid holdings — ask: "If I needed to sell this next week and the market was panicking, what price would I actually receive?" If that price is substantially worse than the current quote, the position needs to be sized for the stressed exit price, not the calm one. This is especially important for individual stocks (versus large-cap index funds), leveraged instruments, and any holding where you are a large fish in a small pond.
How the four risks interact
These risks do not occur in isolation. They compound.
In 2008, fat tails (the subprime crisis was a multi-sigma event), correlation breakdown (all risk assets fell together), liquidity evaporation (corporate bond markets froze), and drawdown depth (the S&P 500 fell 57% peak to trough) all happened simultaneously. An investor who was protected against any one of these risks but not the others could still be destroyed.
This is the deepest lesson of risk management: the scenarios that destroy you are precisely the ones where multiple protections fail at once. Sizing your positions for the individual failure of any one protection is not enough. You need to size for the plausible scenario where all of them fail together — because that scenario, while rare, is exactly the one that will wipe you out if you are not prepared.
4. Position sizing: the Kelly criterion and the sleep test
Most investment education focuses on what to buy and when to buy it. Almost none focuses on how much to buy. This is a critical gap, because position sizing has a larger impact on long-term portfolio outcomes than stock selection for most individual investors.
You can be right about a stock and still lose money if you put too much of your portfolio into it. You can be wrong about a stock and suffer no meaningful damage if the position was appropriately small. The asymmetry between these two scenarios means that position sizing is the single most important risk management tool you have.
The Kelly criterion
In the 1950s, John Kelly Jr. — a researcher at Bell Labs working on information theory, not finance — developed a formula for the optimal bet size in a repeated game with known odds. The criterion answers a specific question: if you know the probability of winning and the payoff ratio, what fraction of your bankroll should you bet to maximize the long-term growth rate of your wealth?
The logic is straightforward even without the formula. If you bet too small, you leave money on the table — your edge compounds too slowly. If you bet too large, a single loss (or a run of losses) can destroy your bankroll before the edge has time to work. The Kelly criterion finds the sweet spot: the bet size that grows your wealth fastest without risking ruin.
Applied to investing, the Kelly criterion would tell you to put a specific percentage of your portfolio into each position based on your estimated edge and the odds. A high-conviction position with a large expected edge gets more capital. A speculative position with a thin edge gets less.
Why you should use half-Kelly or less
In practice, full Kelly sizing is too aggressive for individual investors, for three specific reasons.
You do not know the true odds. Kelly assumes you know the probability of each outcome precisely. In investing, you are estimating — and your estimates have wide error bars. If your estimate of the probability of success is off by even ten percentage points, full Kelly sizing can turn a winning strategy into a losing one.
The emotional cost of drawdowns is nonlinear. Full Kelly sizing produces drawdowns of 50% or more with uncomfortable frequency. Mathematically, this is fine — the formula accounts for recovery. Psychologically, a 50% drawdown causes most people to panic and sell, converting a temporary loss into a permanent one. The theoretical optimum is irrelevant if you cannot sit through the drawdowns it produces.
Your investment "game" is not repeated enough. Kelly works best in games with thousands of repeated bets — poker, sports betting, insurance pricing. Most individual investors make a handful of meaningful investment decisions per year. The sample size is too small for the mathematical law of large numbers to rescue you from a bad run.
The standard professional practice is "fractional Kelly" — betting a fraction (typically one-half or one-quarter) of what the full Kelly criterion recommends. Half-Kelly sacrifices roughly 25% of the theoretical long-term growth rate in exchange for cutting the maximum expected drawdown roughly in half. For almost every individual investor, this is an excellent trade.
The sleep test
But even fractional Kelly requires you to estimate probabilities and expected returns, which is hard to do honestly. There is a simpler heuristic that captures most of the value.
The sleep test: if a position is large enough that you would check its price first thing in the morning with anxiety, it is too large.
This sounds imprecise. It is. That is the point. Your anxiety response integrates information that your conscious analysis might miss — the uncertainty you are not fully accounting for, the tail risks you have rationalized away, the correlation with other positions you have not computed. If a position makes you anxious, your subconscious is telling you something your spreadsheet is not.
The sleep test will not tell you the optimal position size. It will tell you the maximum position size that is compatible with maintaining the emotional stability required to execute your strategy over months and years. This is a lower bar than mathematical optimality, but it is the bar that matters for anyone who is not a robot.
A practical sizing framework
Given everything above, here is a framework that captures the key principles without requiring you to compute anything you cannot honestly estimate.
Core positions (high conviction, large and liquid): 5-10% of portfolio. These are the positions where you have done the full analysis — read the financials, built a valuation, stress-tested the thesis. Even at high conviction, no single position should exceed 10% for an individual investor. Concentration beyond this level means a single stock's bad quarter can meaningfully damage your overall returns.
Satellite positions (moderate conviction, smaller or less liquid): 2-5% of portfolio. These are positions where you have a thesis but lower confidence, or where the asset is less liquid and the exit may be difficult under stress.
Speculative positions (early-stage thesis, high uncertainty): 1-2% of portfolio. These are positions where you are explicitly accepting that you might be wrong, and sizing accordingly. The position is small enough that a total loss does not damage your portfolio. The upside, if you are right, is still meaningful in absolute terms because the potential return is high.
Cash or cash-equivalents: enough to sleep. This is not a fixed percentage. It is whatever amount allows you to look at a 30% market decline and feel that you have options rather than panic. For some people that is 10%. For others it is 30%. There is no correct number — only the number that is correct for you.
The trade-off in conservative sizing
The cost of conservative position sizing is real: you will underperform a more concentrated portfolio in the scenarios where your picks are right. If you put 5% into a stock that triples, your portfolio gains 10%. If you had put 25% in, you would have gained 50%. The regret from under-sizing a winner is genuine and it hurts.
But the math is asymmetric. The 25% position that triples makes you 50%. The 25% position that goes to zero costs you 25% of your portfolio — which requires a 33% gain from the remainder just to get back to even. Conservative sizing trades away the euphoria of concentrated wins for the survival guarantee that keeps you in the game long enough for your edge to compound. Over a 25-year investing career, survival is worth more than any single winner.
5. The pre-mortem technique: your agent's best risk job
In 2007, psychologist Gary Klein described a technique he called the "pre-mortem." The idea is the opposite of a post-mortem: instead of analyzing what went wrong after a failure, you imagine that a decision has already failed and then work backward to figure out why.
Applied to investing, the pre-mortem works like this: you take a position you are considering (or already hold), assume it is now three to five years later, and the investment has been a disaster. Then you write the story of how it happened. Not vaguely — specifically. What went wrong? What changed in the business, the market, the macro environment? What did you miss? What did you see but rationalize away?
The pre-mortem is the single most valuable risk exercise you can do with an agent. Here is why.
Why the pre-mortem works
The human mind has a well-documented optimism bias when evaluating decisions it has already made or is inclined to make. Once you have decided you like a stock, your brain actively filters information to confirm that decision. The pre-mortem circumvents this by changing the framing: you are not asking "could this go wrong?" (which triggers defensive reasoning) but "it did go wrong — tell me the story" (which triggers explanatory reasoning). The second framing produces far richer and more honest scenarios.
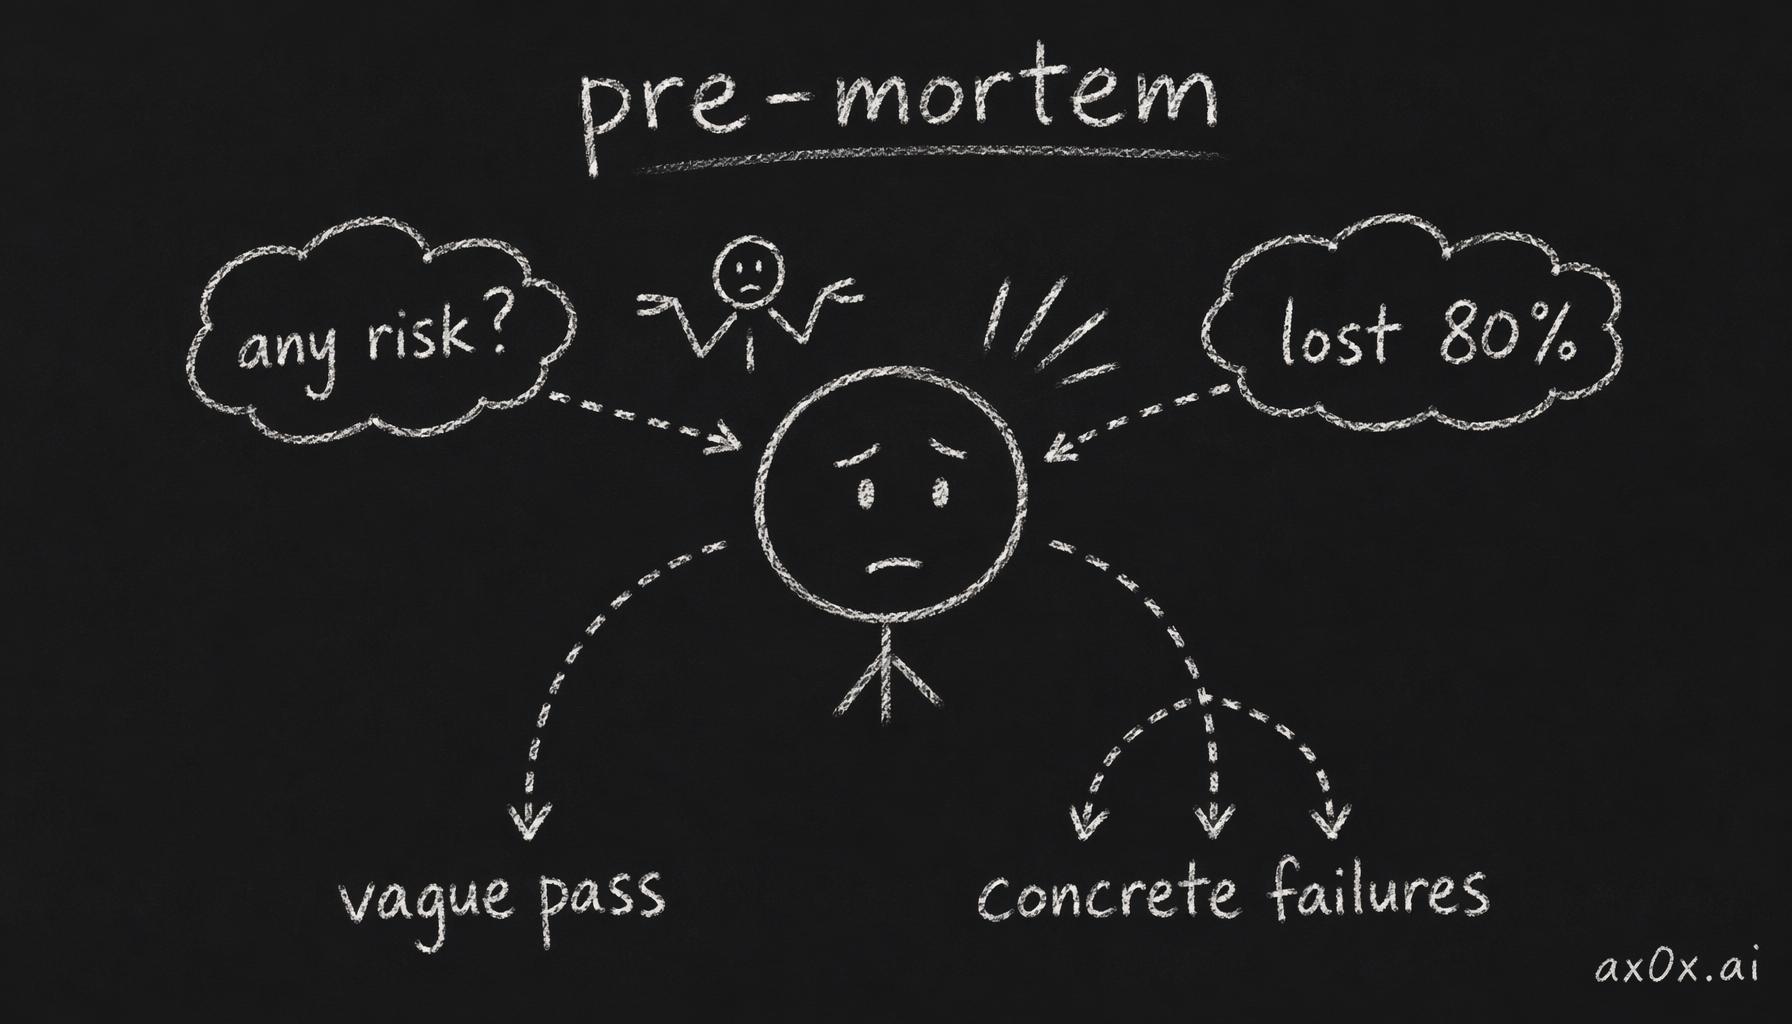 How the pre-mortem works: the same brain, reframed — 'any risk?' gets a vague pass, but 'it already lost 80%, how?' forces concrete failure paths
Klein found that pre-mortems increased the ability to correctly identify reasons for future outcomes by roughly 30% compared to standard prospective analysis. The technique works because it gives people permission to articulate doubts they might suppress in a group setting — or, for a solo investor, doubts they might suppress in their own mind.
How to run a pre-mortem with an agent
The most effective approach is to give your agent a specific instruction: "It is 2030. My position in [company] has lost 70% of its value. Write a detailed, plausible narrative explaining what happened. Include at least one scenario I have not considered."
The agent is well-suited to this task because it can draw on a broad base of historical analogies, identify sector-specific risk factors, and construct coherent narratives without the emotional attachment you have to the position. An agent writing a pre-mortem for your position does not feel the discomfort of contradicting your thesis. It will tell you that the moat you believe in eroded, that the management you trust made a disastrous acquisition, that the market you are betting on was disrupted by a technology that did not exist when you made the investment.
The output is typically three to five specific failure scenarios, each with a narrative arc: what changed, when the warning signs appeared, why you did not act on them, and how the loss compounded.
What to do with the output
Read each scenario and ask three questions:
Is this plausible? Not "is this likely" — plausibility is a lower bar. If you cannot articulate why a scenario is implausible, it is plausible, and you need to account for it.
Would I detect this in time? If the scenario describes a slow erosion — gradually declining margins, a competitor quietly gaining share, management slowly increasing leverage — would you notice it before the damage was done? If the answer is no, you need a monitoring system, which is a legitimate agent task (and one Chapter 8 covers in detail).
If this happened, would my position size survive it? This is where the pre-mortem connects to the previous section on position sizing. If the scenario would produce a loss that materially damages your portfolio, the position is too large for the risk.
The consensus trap
Here is where the pre-mortem technique has a subtle failure mode that you need to be aware of.
Agents generate scenarios based on patterns in their training data. This means they are very good at surfacing risks that the broader market has already discussed: the obvious competitive threats, the well-known regulatory risks, the consensus bear case. These are useful — they ensure you have not missed anything obvious — but they are not sufficient.
The risks that actually destroy portfolios are typically the ones that the consensus did not see coming. The 2008 crisis was not caused by risks that analysts were debating — it was caused by risks that almost no one was discussing publicly (the correlated default risk in mortgage-backed securities, the interconnection between insurance companies and banks through credit default swaps). The COVID crash was caused by an event no financial model was tracking.
If your agent's pre-mortem contains only the risks that Wall Street analysts are already writing about, you have a consensus bear case, not a genuine stress test. You need to push further. Ask the agent: "Now give me a scenario that is not in any analyst report — something structural, something that comes from outside the industry, something that would make the standard bear case look quaint." The agent may not produce a great answer. But the act of asking forces you to acknowledge that the worst risks are the ones you have not imagined.
And here is the hardest part: you need to generate some of the failure scenarios yourself, from your own knowledge of the company, the industry, and the world. The agent can expand and stress-test your scenarios, but the truly novel ones — the ones that come from connecting dots that the training data does not contain — have to originate with you. Risk management, at its core, is an act of imagination, and imagination cannot be fully delegated.
6. What agents do well vs. what only you decide
Throughout this chapter, a pattern has emerged: agents are powerful tools for certain aspects of risk management and completely inadequate for others. Making this boundary explicit is the goal of this section.
What agents do well
Historical risk statistics. Computing drawdowns, rolling volatility, value-at-risk, maximum loss periods, recovery times — all of this is mechanical computation that agents perform faster and more accurately than you. Let them. The numbers are useful as descriptive statistics of past behavior, as long as you remember that past behavior does not predict crisis behavior.
Stress testing against known scenarios. "What would have happened to this portfolio in 2008? In 2020? In the 1987 crash?" These are questions with definitive answers, and agents can compute them quickly across multiple historical periods. The results tell you how your portfolio would have performed in crises that already happened — which is not a prediction of future crises, but is useful for calibrating your intuitions about downside exposure.
Scenario modeling. "If interest rates rise 200 basis points, what happens to this company's debt service cost and free cash flow?" Agents can model scenarios across a range of assumptions quickly, helping you understand which variables your position is most sensitive to. This is directly connected to the sensitivity analysis from Chapter 5 — the assumption your valuation is most sensitive to is also the variable your risk analysis should focus on.
Peer comparison on risk metrics. "Compare the drawdown history, debt-to-equity trajectory, and cash flow volatility of these three companies." Agents are excellent at pulling together comparative data that would take you hours to compile manually. The comparison helps you understand relative risk within a sector — which company is more fragile, which has more cushion.
Pre-mortem narrative generation. As discussed in the previous section, agents are well-suited to constructing detailed failure narratives because they can draw on broad historical analogies without the emotional bias you bring to positions you own.
What only you decide
What you can afford to lose. No agent knows your financial situation, your obligations, your income stability, your time horizon, or your psychological relationship with money. Position sizing and overall portfolio risk are decisions that depend entirely on factors the agent does not have access to and cannot evaluate. An agent can tell you the historical maximum drawdown of a stock. It cannot tell you whether a 40% drawdown in that stock would cause you to panic-sell, miss a mortgage payment, or abandon your investment strategy entirely.
Which scenarios to take seriously. The agent will give you twenty possible failure scenarios. Some of them are plausible. Some are theoretically possible but practically irrelevant. Some are the ones that keep you up at night. Only you can decide which scenarios require action — which ones justify reducing a position, adding a hedge, or selling entirely. This is judgment, and it cannot be computed.
When to override the model. Every risk model, every stress test, every pre-mortem has assumptions. At some point, you will encounter a situation where the model says one thing and your gut says another. Sometimes the model is right and your gut is anchored to irrelevant information. Sometimes your gut is picking up on something the model cannot capture — a pattern you have seen before, a management behavior that reminds you of a previous failure, a macro signal that does not fit neatly into quantitative categories. The skill is knowing which to trust in which situations, and that skill comes from experience, not from a formula.
Your circle of competence boundaries. Buffett and Munger emphasized repeatedly that the most important investment decision is knowing what you do not know. An agent will happily analyze any company in any industry with equal confidence. You should not invest with equal confidence across all industries. The sectors where you have real knowledge — whether from your career, your hobbies, or years of study — are the ones where your risk judgment is calibrated. Outside those sectors, your risk estimates are guesses, regardless of how precise the agent's output looks. Chapter 7 formalizes this as a component of your written thesis, but the principle applies here: the risk of a position you do not truly understand is always higher than the risk your model reports.
The honest assessment of agent-assisted risk management
Agent-assisted risk management is genuinely better than no risk management, which is what most individual investors practice. The average retail investor has no drawdown budget, no position sizing framework, no pre-mortem process, and no systematic way to monitor whether their thesis is still intact. If using an agent gets you from "no process" to "some process," the improvement is enormous.
It is not, however, a substitute for the judgment that comes from investing through multiple market cycles. An agent can tell you what a 50% drawdown looks like historically. It cannot tell you what it feels like to watch your portfolio lose half its value over six months while every headline tells you it will get worse. That emotional experience — and the discipline to either hold or sell based on your thesis rather than your fear — is something that only time and experience can develop.
The curriculum is a training ground, as Chapter 1 framed it. The real education happens when you have real money at stake and the market tests your risk management in ways no textbook or agent can simulate. The goal of this chapter is to make sure you survive that education — that your position sizes are small enough, your diversification is honest enough, and your pre-mortem process is thorough enough that the inevitable losses teach you rather than destroy you.
Workshop — The 2030 post-mortem
Time: 45–60 minutes. Tools: Any AI agent you already have. Output: A saved document with a pre-mortem narrative and a sizing decision.
Instructions
Step 1 — Pick a position. Either a stock you currently own, one you are seriously considering, or the company you have been following through the curriculum workshops. You need a specific company with a specific thesis — even if the thesis is informal.
Step 2 — Write your thesis in two sentences. Why do you believe this investment will work? What is the core assumption it depends on? This does not need to be polished. It needs to be honest. If you have done the Chapter 5 workshop, you already know which assumption your valuation is most sensitive to. That assumption is the center of your thesis.
Step 3 — Run the pre-mortem. Give your agent this instruction (adapt the wording to your style): "It is 2030. My position in [company] has lost 70% of its value from today's price. Write a detailed, plausible narrative of how this happened. Include specific events, dates if possible, and at least one scenario that is not part of the current consensus bear case. Then tell me what warning signs I should have noticed in 2026 or 2027."
Step 4 — Read the output without arguing. Your first instinct will be to rebut the agent's scenarios. Resist this for the first read. Just absorb.
Step 5 — Evaluate each scenario against three questions.
For each failure narrative the agent provides, write:
- Plausible? (yes / no / unsure)
- Would I detect it in time? (yes / no / maybe — and how?)
- At my current position size, would this loss change my life? (yes / no)
If any scenario receives "yes" on the third question and "plausible" on the first, the position is too large. This is not a theoretical exercise. This is the actual decision: reduce the position until no plausible disaster scenario changes your life.
Step 6 — Write your own scenario. Without agent help, write one failure narrative that the agent did not generate — something from your own knowledge of the industry, the management team, or the macro environment. This is the hardest step and the most important one. The scenarios the agent misses are the ones most likely to be genuine blind spots.
Step 7 — Make a sizing decision. Based on everything above, write one of three conclusions:
- "Position size is appropriate — no plausible scenario exceeds my loss tolerance."
- "Position is too large — reducing to [X]% of portfolio."
- "I need more information before I can decide — specifically, I need to understand [Y]."
Save this document with the company ticker and today's date. If you are following the curriculum sequentially, you will use this as an input for the thesis writing workshop in Chapter 7.
Why this matters
This workshop is the practical synthesis of the entire chapter. The pre-mortem converts abstract risk concepts into specific scenarios. The sizing decision converts specific scenarios into portfolio action. The self-generated scenario forces you to exercise the one risk skill that cannot be delegated.
If you do this exercise honestly, you will either confirm that your position sizing is appropriate — which gives you the confidence to hold through volatility — or discover that it is not, which gives you the opportunity to fix it before the market forces you to. Either outcome is valuable. Both are available only to investors who bother to ask.
What risk looks like from here
Risk is not a number. It is not standard deviation, value-at-risk, or beta. Those are measurements of normal variation, and normal variation is not what destroys portfolios.
Risk is the probability of a loss you cannot afford — and "cannot afford" is a judgment that depends on your specific financial situation, your time horizon, your obligations, and your psychological capacity to endure drawdowns without abandoning your strategy. No model can compute this for you. No agent can decide it for you.
What models and agents can do is help you think about risk more systematically: identifying historical patterns, stress-testing against known scenarios, generating failure narratives, computing the arithmetic of drawdown and recovery. These are valuable tools. They are not substitutes for the judgment they serve.
LTCM had the best models in the world, built by the people who invented the theory the models were based on. The models measured everything that could be measured. They missed everything that mattered.
Your edge in risk management is not better computation. It is the willingness to ask: what am I not seeing?
Chapter 7 covers thesis discipline: six elements of a defensible thesis, red-teaming with agent-as-short-seller, and version control for convictions — because a thesis you did not write down will drift until it means nothing. Bring your pre-mortem document from this workshop. It becomes one of the inputs.