Commanding an Agent Fleet — Five Core Patterns
Chapter 8 of 10 in the AI-Native Investor curriculum.
Most people use agents the way a new manager uses their first team: they hand the whole problem to one person and hope for a good answer. "Should I buy NVDA?" goes to Claude, and what comes back is a fluent, confident, well-structured analysis — balanced, reasonable, and almost entirely consensus. The output reads like investment research. It is not. It is a sophisticated summary of what everyone already thinks, dressed in the vocabulary of original analysis.
This is the single-agent trap, and nearly everyone falls into it.
A single agent cannot cross-check its own work. It cannot adopt two genuinely opposing viewpoints simultaneously. It defaults to the center of whatever distribution its training represents — which, for popular stocks, means the median sell-side analyst opinion restated in clearer prose. The more confident the output sounds, the less likely it contains anything the market has not already priced in.
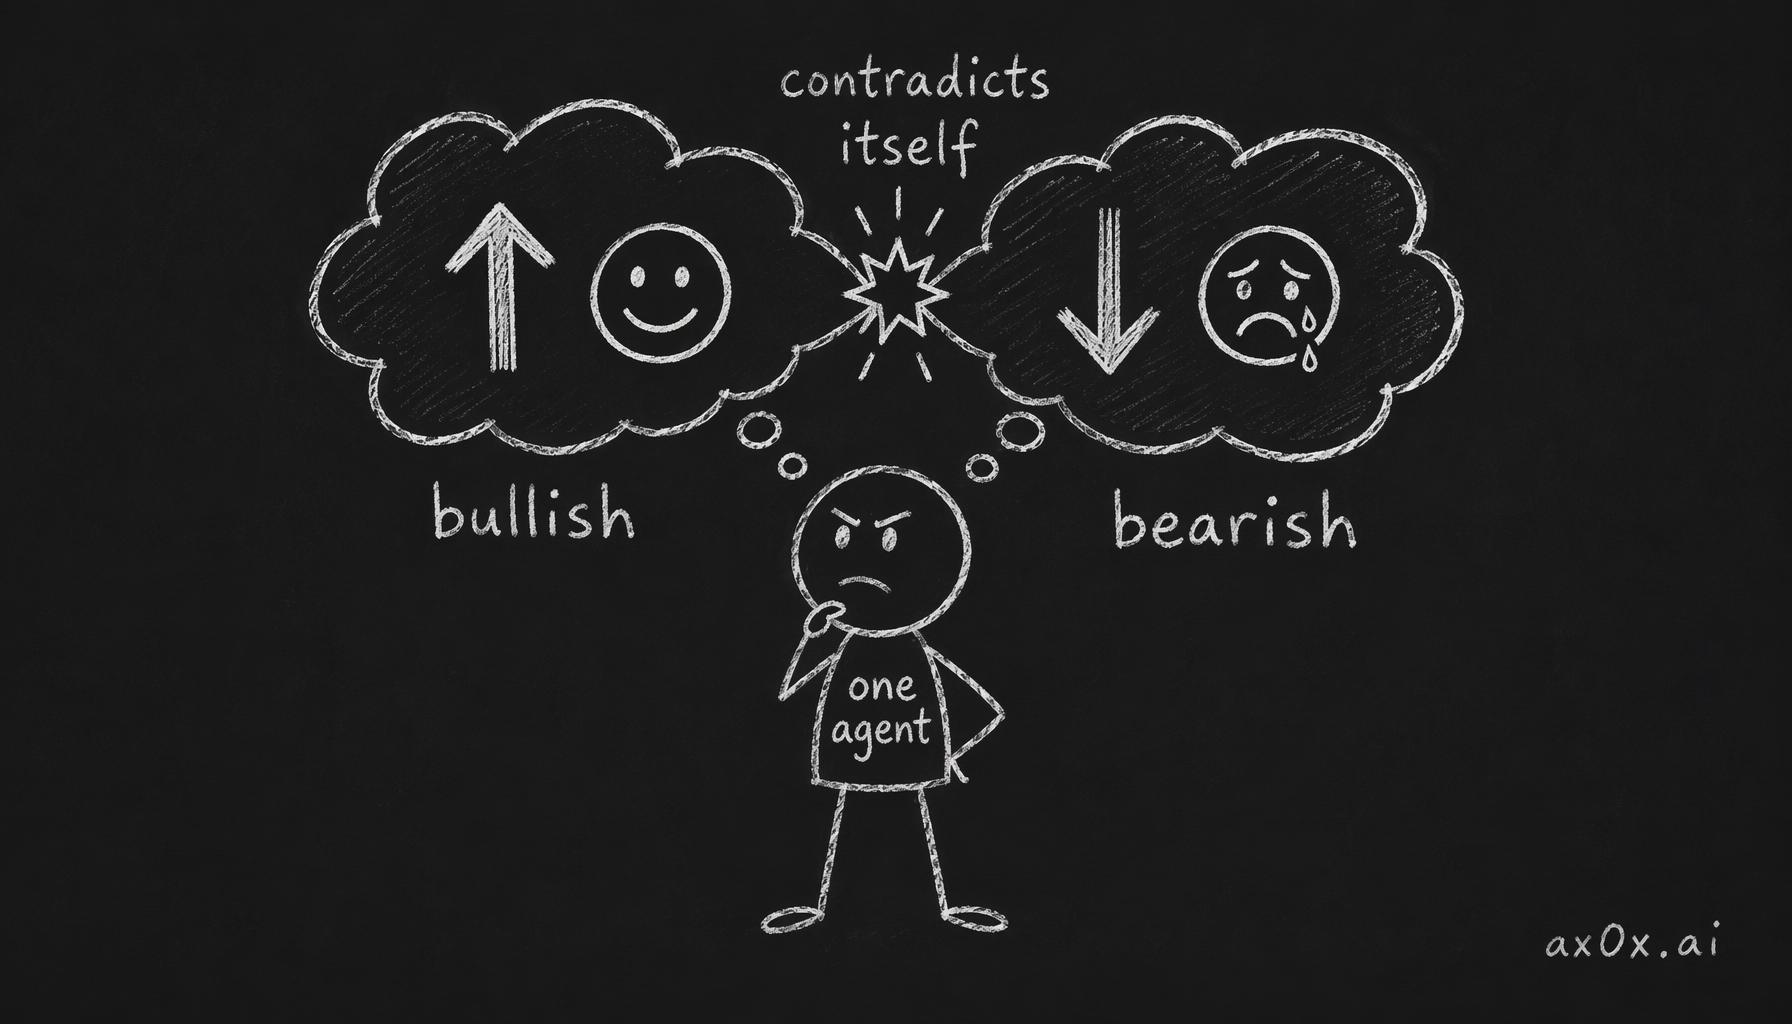 A single agent forced to argue both the bull and bear case at once — two opposing views collide in one head and the output contradicts itself.
The shift from a single agent to a fleet is not a matter of scale. It is a change in the kind of work that becomes possible. A fleet with defined roles, explicit handoffs, and cross-verification can do something a single agent fundamentally cannot: surface disagreements between independent analyses and force you to resolve them with your own judgment.
This chapter teaches five patterns that cover roughly 90% of investment research workflows. Three reference implementations show how the patterns combine in practice. And because agent fleets have failure modes that are genuinely dangerous for financial analysis, we end with four specific ways they go wrong and how to detect each one.
Core arguments
- A fleet is not "more agents." It is structured disagreement. The value comes from designing roles that produce tension, not from parallelizing the same task.
- Five patterns — delegation, verification, iteration, composition, failure detection — handle most investment workflows. You do not need a framework more complex than this.
- Financial agents have four specific failure modes that differ from general-purpose agent failures. Outdated data, consensus blindness, fabricated sources, and unit errors. Each requires a different detection strategy.
- Fleet complexity has diminishing returns. For most individual investors, a two-to-three agent workflow covers the important ground. Over-engineering the fleet is itself a form of procrastination — productive-feeling activity that substitutes for the harder work of forming judgment.
Table of contents
- Pattern 1 — Delegation: break the job before you hand it out
- Pattern 2 — Verification: independent checks, not proofreading
- Pattern 3 — Iteration: loops that converge, not loops that spin
- Pattern 4 — Composition: assembling partial outputs into a whole
- Pattern 5 — Failure detection: knowing when the fleet is wrong
- Three reference workflows
- Single agent vs. fleet — when the complexity is worth it
- The trust meta-question
- Four failure modes of financial agents
- Bloomberg still wins — and why that is fine
- Workshop: design your fleet
1. Delegation: break the job before you hand it out
Delegation is the most intuitive pattern and the most commonly botched.
The instinct is to give an agent a large, open-ended task: "Research whether Costco is a good investment." This is the equivalent of telling a new hire on their first day, "Figure out our competitive strategy and present it to the board on Friday." The problem is not that the person is incompetent. The problem is that the task has no defined scope, no success criteria, and no intermediate checkpoints. The output will be whatever the person thinks you want, filtered through whatever they happen to know, organized however seems reasonable. It will look professional and be largely useless.
Effective delegation requires decomposition before assignment. The work gets broken into pieces that are specific enough to verify independently. Each piece has a defined input, a defined output, and criteria for what "done" looks like.
For investment research, the decomposition usually follows the structure this curriculum has been building across Chapters 3 through 7:
Data gathering. Pull the last five years of financial statements for Company X. Compute revenue growth rates, margin trends, free cash flow conversion, and debt-to-equity trajectory. Flag any year where a metric changed by more than 20% from the prior year.
Pattern recognition. Given these five years of financials, identify which of the three financial statement lenses (Chapter 4) shows the most concerning trend. Explain in three sentences why.
Valuation framing. Using the data from the first task, construct a DCF under three scenarios — base, optimistic, and pessimistic. For each scenario, state the one assumption that drives the most variance in the output (Chapter 5).
Risk surfacing. List the top five risks to this investment thesis, categorized by the four risk types from Chapter 6. For each risk, estimate probability (low/medium/high) and potential impact.
Thesis draft. Using the outputs from the four previous tasks, draft a 200-word thesis using the six elements from Chapter 7.
Notice what happened: one vague request became five specific ones, each building on the previous. The outputs are independently verifiable. If the data gathering step produces numbers that do not match what you find on a financial data site, you catch it before the entire analysis is built on bad inputs. If the pattern recognition step flags something you disagree with, you can challenge it without unwinding everything downstream.
The trade-off
Decomposition takes effort. You have to understand the problem well enough to break it into pieces — which means you need the investment fundamentals from Chapters 3 through 7 before effective delegation is possible. This is the chicken-and-egg problem Chapter 1 warned about: you cannot delegate what you do not understand, but you cannot learn everything before you start delegating.
The practical resolution is iterative: start with rough delegation, notice where the output disappoints, decompose that specific piece more precisely, and repeat. Your decomposition quality improves as your investment knowledge deepens. The first time you run this workflow, your five sub-tasks will be imprecise and the outputs will require heavy manual correction. The tenth time, your sub-tasks will be sharp enough that the outputs need only verification, not rewriting.
There is also a granularity trap at the other extreme. If you decompose too finely — "compute the year-over-year change in cost of goods sold for Q3 2024 vs. Q3 2023" — you are doing the work yourself with extra steps. The agent becomes a calculator, and you lose the benefit of its ability to synthesize across data points. The sweet spot is sub-tasks large enough that the agent exercises judgment, but specific enough that you can tell whether the judgment was sound.
2. Verification: independent checks, not proofreading
Verification is the pattern that separates a useful fleet from an expensive echo chamber.
The naive version of verification is asking a second agent to "check" the first agent's work. This almost never catches meaningful errors, for the same reason that asking a colleague to proofread a report rarely catches flawed reasoning. The second agent reads the first agent's output, finds it internally consistent and clearly written, and confirms it. What it does not do is independently arrive at the same conclusion — or a different one — using different methods or data sources.
Effective verification means the second agent does not see the first agent's output. Instead, it receives the same underlying question and produces its own answer independently. You then compare the two answers. Agreement means one of two things: both agents converged on the same conclusion from different starting points (genuinely reassuring), or both agents drew from the same training data and produced the same consensus view (not reassuring at all). The challenge is distinguishing between the two — and we will address that in the trust section below.
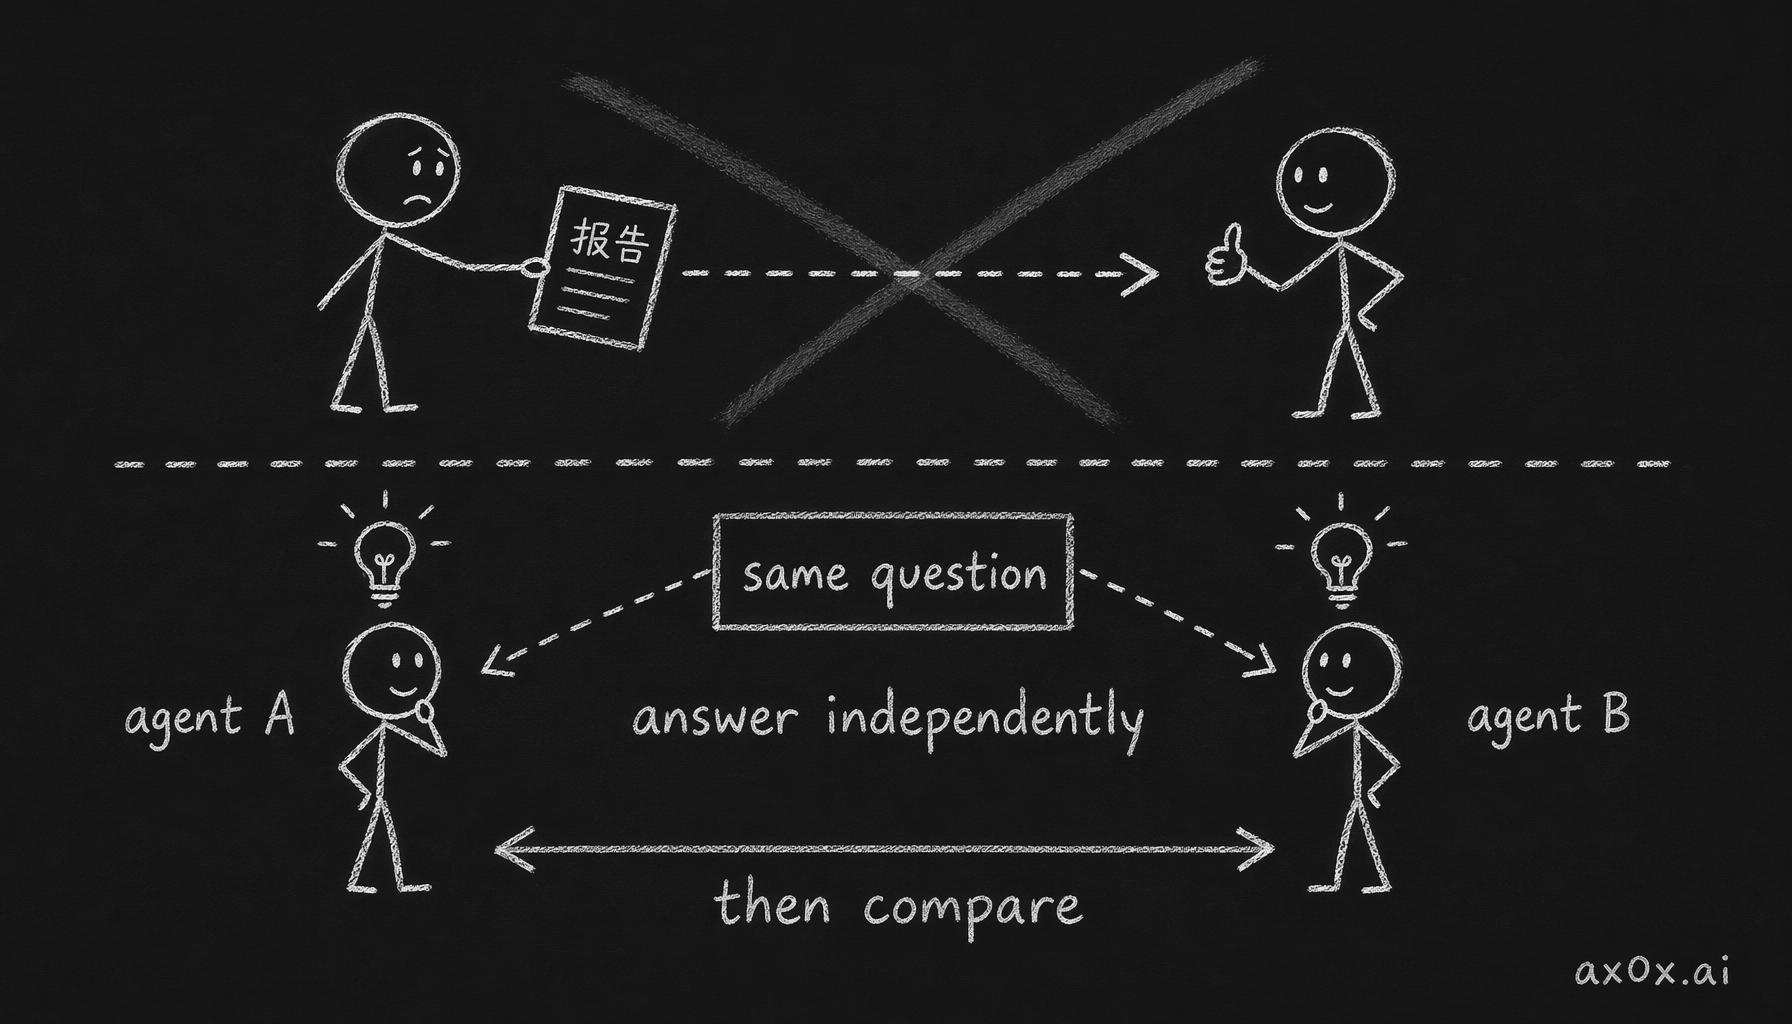 Real verification isn't a second agent proofreading the first's report — the same question goes to two agents independently, and you compare their separate answers.
The project management analogy is the difference between peer review and independent audit. In peer review, a second analyst reads the first analyst's memo and looks for errors. In an independent audit, a second analyst is given the same raw data and asked to reach their own conclusion. Peer review catches typos and arithmetic mistakes. Independent audit catches flawed reasoning, missed risks, and alternative interpretations.
For investment research, effective verification looks like this:
Parallel valuation. Agent A builds a DCF. Agent B, without seeing Agent A's model, builds a multiples-based valuation and an asset-based valuation. You compare all three. If the DCF says $180 and the multiples say $120, the interesting question is not which is "right" — it is what assumptions in the DCF justify a 50% premium over what the market's comparables imply.
Adversarial fact-check. Agent A produces a research memo. Agent B receives only the key claims from that memo — without the supporting arguments — and is asked to find evidence that contradicts each claim. This is not proofreading. This is red-teaming (Chapter 2), applied as a verification step rather than a standalone role.
Source triangulation. Agent A pulls revenue figures from one source. Agent B pulls the same figures from a different source. If they match, you have higher confidence. If they disagree, you know to check manually — and you have caught an error that a single-agent workflow would have silently propagated into the rest of the analysis.
The trade-off
Independent verification roughly doubles your cost and time for every step you apply it to. For individual investors, applying it to everything is neither practical nor necessary. The skill is knowing which outputs to verify independently and which to accept after a quick sanity check.
The heuristic: verify independently when the output will be load-bearing in your final decision. A revenue growth rate that feeds directly into your DCF deserves source triangulation. A brief industry overview that provides context but does not drive any numbers probably does not. Verify the foundations; trust the scaffolding.
There is also a subtle failure mode where verification creates false confidence. Two agents agreeing does not mean the answer is correct — it may mean both agents are drawing from the same flawed data source, or both are reproducing the same consensus narrative. Verification catches independent errors. It does not catch systematic ones. For systematic errors, you need Pattern 5 — failure detection.
3. Iteration: loops that converge, not loops that spin
Iteration is the pattern of feeding an output back into the process to improve it. The concept is simple. The execution is where most people waste enormous amounts of time.
The productive version of iteration has three properties: each cycle has a specific improvement target, there is a clear convergence criterion, and there is a maximum number of cycles. Without all three, iteration degenerates into an infinite loop of rephrasing the same analysis in slightly different ways — each version feeling incrementally "better" while adding no new information.
Here is what productive iteration looks like for a thesis document.
Cycle 1 — Draft. Agent produces a first-draft thesis using the six elements from Chapter 7. You read it, identify the weakest element. Suppose the kill criteria are vague — "if the stock drops 30%" is not a kill criterion; it is a stop-loss. A real kill criterion is "if management announces a pivot away from the enterprise segment, which currently generates 65% of gross margin."
Cycle 2 — Targeted revision. You tell the agent specifically what is wrong: "The kill criteria are price-based, not thesis-based. Rewrite them as conditions that would invalidate the investment thesis regardless of price." The agent rewrites. You compare: are the new kill criteria falsifiable? Do they reference specific business conditions rather than market prices? If yes, move to the next weak element. If no, give more specific feedback and run one more cycle on this element.
Cycle 3 — Red team. The revised thesis goes to a second agent playing red team. The red team produces three attacks. You assess each: does the attack land? If it exposes a genuine weakness, you revise the thesis. If it is a generic objection ("competition could increase"), you note it and move on. The goal is not to produce an attack-proof thesis — that does not exist — but to ensure the thesis has already survived the obvious attacks before you put money behind it.
Convergence criterion. Iteration stops when the red team's attacks no longer reveal weaknesses you had not considered. If the attacks start repeating themselves or become increasingly generic, you have extracted what this process can give you.
Maximum cycles. Three to five rounds is usually sufficient for a thesis document. If you are on round eight, you are not improving the thesis — you are avoiding making a decision.
The trade-off
Iteration feels productive even when it is not. Each cycle produces a visibly "improved" document, which triggers the same satisfaction as making progress on real work. The danger is spending four hours polishing a thesis through twelve agent cycles instead of spending one hour on three cycles and three hours on primary research that might actually change your mind.
The honest signal that iteration has become procrastination: you are no longer surprised by anything the agent produces. If every cycle confirms what you already thought, the loop has stopped generating information and started generating comfort.
Charlie Munger's observation applies here: "Invert, always invert." If your iteration loop only makes the thesis stronger, you are doing confirmation work, not analytical work. At least one cycle should be designed to find the strongest argument against your position. If you cannot bring yourself to run that cycle, you are not iterating — you are polishing.
4. Composition: assembling partial outputs into a whole
Composition is combining outputs from multiple specialized agents into a single coherent product. It sounds straightforward. The failure mode is subtle.
The project management version: you have four team members, each responsible for one section of a client presentation. Each section is individually excellent. But the presentation as a whole is incoherent — the sections use different assumptions about the market size, contradict each other on the competitive landscape, and reach conclusions that do not follow from each other's analysis.
The same thing happens with agent fleets. Agent A produces a bullish revenue forecast. Agent B produces a risk analysis that assumes a moderately declining revenue environment. Agent C produces a valuation based on Agent A's numbers. The final memo reads well paragraph by paragraph, but the thesis is internally contradictory — optimistic on revenue, pessimistic on risk, with a valuation that cherry-picks the optimistic scenario.
Preventing this requires what a good project manager does before the team starts working: establish shared assumptions. In a fleet context, this means creating an explicit assumptions document that every agent task references.
The assumptions anchor. Before any agent starts work, you state the key assumptions: revenue growth rate range, margin trajectory, competitive environment, macro conditions. Every agent's task includes these assumptions as constraints. When an output deviates from the shared assumptions, it must say so explicitly and explain why.
The integration step. After the specialized outputs are produced, a separate agent — or you, which is often better — reads all outputs together with a single question: "Where do these outputs contradict each other?" The contradictions are not errors to be smoothed over. They are the most valuable part of the process. A revenue forecast that conflicts with a risk analysis means one of them is wrong, or the scenario space is wider than you thought. Either finding is information.
The narrative thread. The final composition step is not stitching paragraphs together. It is writing the story that connects the evidence to the conclusion. This is almost always a task you should do yourself, not delegate. The narrative is where your judgment lives — which evidence matters most, which risks are dealbreakers, what the thesis ultimately depends on. An agent can draft the narrative, but if you do not rewrite it in your own reasoning, you do not own the thesis. And if you do not own the thesis, you will not have the conviction to hold it when the price drops 20% and the narrative is being tested.
The trade-off
Composition is the most time-consuming pattern, and the temptation to skip it is strong. You have four excellent partial analyses — why not just read them sequentially and form an impression? The answer is that your brain will silently resolve contradictions in favor of whatever conclusion you already prefer. The explicit comparison forces you to confront the contradictions rather than smooth them away. But it takes 30 to 60 minutes of focused work per company, which limits how many companies you can run this process for.
The practical implication: use full composition for the two or three companies in your final consideration set. Use lighter-touch synthesis (read the outputs sequentially, flag anything surprising, move on) for the broader screening stage where you are eliminating candidates rather than building theses.
5. Failure detection: knowing when the fleet is wrong
The first four patterns assume the fleet's outputs are directionally useful and need refinement. This pattern addresses the case where the fleet's output is wrong in ways that look right — which, for financial analysis, is the most dangerous failure mode.
The core problem: agent outputs about financial topics are articulate, well-structured, and confidently stated regardless of whether they are correct. There is no correlation between the confidence of the output and its accuracy. An agent that fabricates a revenue figure states it with the same fluency as one that pulls it from a verified source. An agent that misinterprets a balance sheet item presents its misinterpretation as clearly as a correct interpretation.
You cannot rely on the output's quality of prose to judge its quality of analysis. The detection has to come from outside the output itself.
Anchoring to known facts. Before asking agents to analyze a company, look up two or three basic facts yourself: last year's revenue, current market cap, approximate number of employees. These serve as anchors. If the agent's output states a revenue figure that is off by a factor of two, you catch it immediately. If you do not have anchors, you are reading the output blind — and the more articulate it is, the more likely you are to accept it uncritically.
Cross-referencing with primary sources. For any claim that is load-bearing in your thesis, trace it back to a primary source. If the agent says "operating margin expanded 300 basis points over the last three years," verify that against the actual 10-K filings. This sounds tedious. It takes about five minutes per claim. Given that your entire thesis might rest on three to five key claims, that is fifteen to twenty-five minutes of verification for the foundation of an investment decision. Skipping it is not a time-saving — it is a bet that the agent did not hallucinate or pull stale data.
Spotting pattern breaks. Agents tend to produce outputs that are internally consistent but externally disconnected. If every metric in an analysis is improving — revenue up, margins expanding, debt declining, cash flow growing — that is either a genuinely exceptional company or an agent that is telling you a consistent story rather than reporting reality. Real companies have trade-offs: rapid revenue growth usually comes with margin pressure, aggressive expansion usually increases debt. A perfectly improving picture is a signal to verify, not to celebrate.
The "too clean" test. If the agent's analysis reads like a sell-side initiation report — upbeat, well-organized, with every section reinforcing the same conclusion — run a specific check. Ask a separate agent: "Here is a bullish analysis. What is the single strongest piece of evidence that contradicts this thesis?" If the contradicting evidence is substantial and was not mentioned in the original analysis, the original agent was constructing a narrative rather than analyzing evidence. This happens frequently. It is the agent equivalent of confirmation bias, and it is the default mode for financial analysis queries.
The trade-off
Failure detection adds friction to every step. If you verify every number, trace every claim, and red-team every conclusion, the process takes five times as long as accepting the fleet's output at face value. The discipline is knowing which outputs to verify deeply and which to accept with light checks.
The hierarchy: verify data first (numbers are either right or wrong), verify reasoning second (logic can be checked against your own understanding), and verify judgment last (this is where your opinion matters more than the agent's). If the data is wrong, everything built on it is wrong. If the reasoning is flawed, the conclusion does not follow from even correct data. If the judgment is different from yours, that is a disagreement — not an error — and the interesting analytical question is which judgment has better support.
6. Three reference workflows
The five patterns combine differently depending on what you are trying to accomplish. Here are three workflows that cover the most common investment research tasks. They are reference implementations — starting points to adapt, not rigid procedures to follow.
Workflow A — The research pipeline
Purpose: Evaluate a company you know nothing about.
When to use it: You have heard a company mentioned, read an article, or noticed a stock on a screener. You want to go from zero to an informed opinion in two to four hours.
Structure:
Stage 1 — Context (delegation). One agent produces a company overview: what the company does, who its customers are, how it makes money, who the main competitors are, and what the current market narrative is. This is background, not analysis. Time: 10 minutes.
Stage 2 — Financial scan (delegation + verification). Two agents independently pull and analyze financial data. Agent A focuses on the three-lens framework from Chapter 4: income statement patterns, balance sheet fragility, cash flow truth. Agent B focuses on historical performance: five-year revenue trajectory, margin evolution, capital allocation decisions. You compare both outputs for contradictions. Time: 20 minutes.
Stage 3 — Valuation frame (delegation). One agent builds a rough valuation using the methods from Chapter 5. Not a precise fair value — a range, with explicit assumptions for each scenario, and identification of the single most sensitive assumption. Time: 15 minutes.
Stage 4 — Risk check (delegation + iteration). One agent runs the pre-mortem from Chapter 6: "It is 2030. This investment lost 60% of its value. Write the three most plausible stories for why." You read the stories. If any of them are scenarios you had not considered, iterate: "For scenario 2, what would be the earliest observable signal that this is happening?" Time: 20 minutes.
Stage 5 — Synthesis (composition, done by you). You read all outputs. You write — in your own words, not the agent's — a one-paragraph summary: "Here is what I think about this company, and here is what would have to be true for me to invest." Time: 30 minutes.
Total time: Two hours. Half of that is your thinking and writing, which is the point. The agents compressed what used to be a week of data gathering into 90 minutes. The judgment work that remains is irreducible.
Workflow B — The thesis refinement workflow
Purpose: Stress-test a thesis you have already written.
When to use it: You completed the Chapter 7 workshop and have a draft thesis with six elements. You want to pressure-test it before putting money behind it.
Structure:
Stage 1 — Adversarial review (verification). An agent receives your thesis and plays the role of a short seller. Its task: produce the three strongest arguments for why this thesis is wrong. Not generic risks. Specific, evidence-based arguments that target the assumptions your thesis depends on.
Stage 2 — Your response (iteration). For each attack, you write a one-paragraph response: either "this is a real risk, and here is how I am accounting for it in my position size and kill criteria" or "this is wrong, and here is the specific evidence that refutes it." If you cannot write a clear response, the attack has found a genuine weakness.
Stage 3 — Assumption sensitivity (delegation). An agent takes the key assumptions from your thesis and runs sensitivity analysis (Chapter 5): what happens to the valuation if growth is 30% lower than your base case? What if margins compress by 200 basis points? What if the discount rate increases by 1%? The question you are answering: which of my assumptions, if wrong, would change my decision?
Stage 4 — Kill criteria check (iteration). An agent reviews your kill criteria and asks: "For each kill criterion, what data source would I monitor to know whether this condition has been triggered?" If the answer is vague ("general industry trends"), the kill criterion is not operational. Revise it until each criterion maps to a specific, observable metric.
Stage 5 — Version stamp. Save the refined thesis with a date. This is version 2 (version 1 was your Chapter 7 workshop output). Note what changed between versions and why.
Total time: 90 minutes. Most of Stage 2 is your thinking.
Workflow C — The monitoring loop
Purpose: Track an existing position against its thesis.
When to use it: You own a stock and have a written thesis. You want a periodic check (monthly or quarterly) to determine whether the thesis still holds, the kill criteria have been triggered, or something has changed that requires a thesis revision.
Structure:
Stage 1 — Event scan (delegation). An agent reviews the last month of news, earnings releases, and SEC filings for the company. Its output: a list of events, each tagged as "thesis-relevant" or "noise." The tagging is imperfect, but it is a useful first filter.
Stage 2 — Kill criteria check (failure detection). An agent takes your kill criteria and the event scan, and evaluates: "Has any kill criterion been triggered or moved closer to triggering?" This is a binary question per criterion, with supporting evidence.
Stage 3 — Thesis drift check (verification). An agent compares your original thesis to the current state of the company. "Here is the thesis from six months ago. Here is what has happened since. Does the thesis still hold, or does it need revision?" You read the output and compare it to your own assessment.
Stage 4 — Your decision. One of three outcomes: hold (thesis intact, no action), revise (thesis needs updating — return to Workflow B), or exit (kill criterion triggered or thesis no longer holds). You document the decision and the reasoning.
Total time: 30 to 45 minutes per position per month. This is the minimum viable monitoring process for active positions. Skipping it means you are holding positions on faith rather than evidence — which is how belief drift from Chapter 7 silently takes over.
7. Single agent vs. fleet — when the complexity is worth it
Not every task needs a fleet. The honest assessment:
Single agent is sufficient for: quick lookups (current price, market cap, recent earnings date), simple calculations (what is the P/E ratio given these inputs), background research on a topic you will evaluate yourself, and generating study material in tutor mode. These are tasks where the output is either factually correct or obviously wrong, and verification happens naturally as you use the output.
A fleet adds value for: research that will inform a real decision, any analysis where multiple assumptions interact (valuation, risk assessment), thesis construction and stress-testing, and monitoring ongoing positions. These are tasks where errors in the output are not self-evident — they propagate silently into your reasoning, and you only discover them when the investment goes wrong.
The decision criterion is not complexity of the question. It is consequence of being wrong. If you are curious about a company's business model, a single agent is fine — an error costs you nothing but a correctable misunderstanding. If you are deciding whether to allocate 5% of your portfolio based on that business model analysis, the same error costs you money and — worse — undermines your confidence in your own framework.
The fleet-complexity trap
There is a failure mode specific to technically inclined people who discover fleet patterns: building increasingly elaborate multi-agent workflows becomes the project, and the actual investing becomes secondary.
The signs: you spend more time designing agent prompts than reading the agents' output. You have a twelve-agent pipeline with branching logic and conditional handoffs for a portfolio of three stocks. You have redesigned the workflow three times and have not yet made an investment decision using it.
This is procrastination wearing productivity's clothes. The purpose of the fleet is to inform your judgment. The moment the fleet becomes more interesting than the judgment it is supposed to inform, you have inverted the purpose.
For most individual investors managing a portfolio of five to fifteen positions, the following setup covers the important ground:
- One research agent for data gathering and financial analysis
- One red-team agent for adversarial review and thesis attacks
- One monitoring agent for periodic position checks
That is it. Three roles, clear handoffs, manageable complexity. You can run all three roles with the same agent by changing how you frame the request — the "fleet" is conceptual, not necessarily separate systems. What matters is that each role's output is treated independently and compared against the others.
If you find yourself building something more elaborate, ask: what investment decision is this enabling that a three-agent workflow cannot? If the answer is "none, but it is more thorough," you are optimizing the wrong variable.
8. The trust meta-question
When you run multiple agents on the same question, the most informative moment is not when they agree. It is when they partially agree.
All agents agree. This is the least informative outcome, and it feels like the most reassuring one. When every agent in your fleet reaches the same conclusion — bullish on the stock, similar valuation range, same key risks identified — the natural reaction is confidence. The correct reaction is suspicion.
Unanimous agreement from agents usually means one of two things. Either the conclusion is genuinely obvious and already priced in (in which case your analysis has told you nothing the market does not already know), or all agents are drawing from the same training data and reproducing the same consensus view (in which case you have consensus dressed as independent verification).
The test: ask one agent to steelman the opposite position. If the steelman is weak and generic, the consensus might be genuine. If the steelman is specific and compelling, you have a disagreement that the fleet's architecture suppressed rather than surfaced.
All agents disagree. This is uncommon when the agents are using the same data — it usually means the data itself is ambiguous, or the company is in a phase transition where the old patterns do not apply and new patterns have not formed. The correct response is to acknowledge the ambiguity rather than forcing a conclusion. "I do not have enough clarity to make this call" is a valid output. In fact, it is the output that prevents the most expensive mistakes — the ones that come from forcing conviction on insufficient evidence.
Partial agreement. This is the most informative outcome and the one that actually exercises your judgment. Agent A says the revenue growth story is strong but the balance sheet is concerning. Agent B says the balance sheet is fine but the valuation already reflects the growth story. Agent C says neither the growth nor the valuation matters if the regulatory risk materializes.
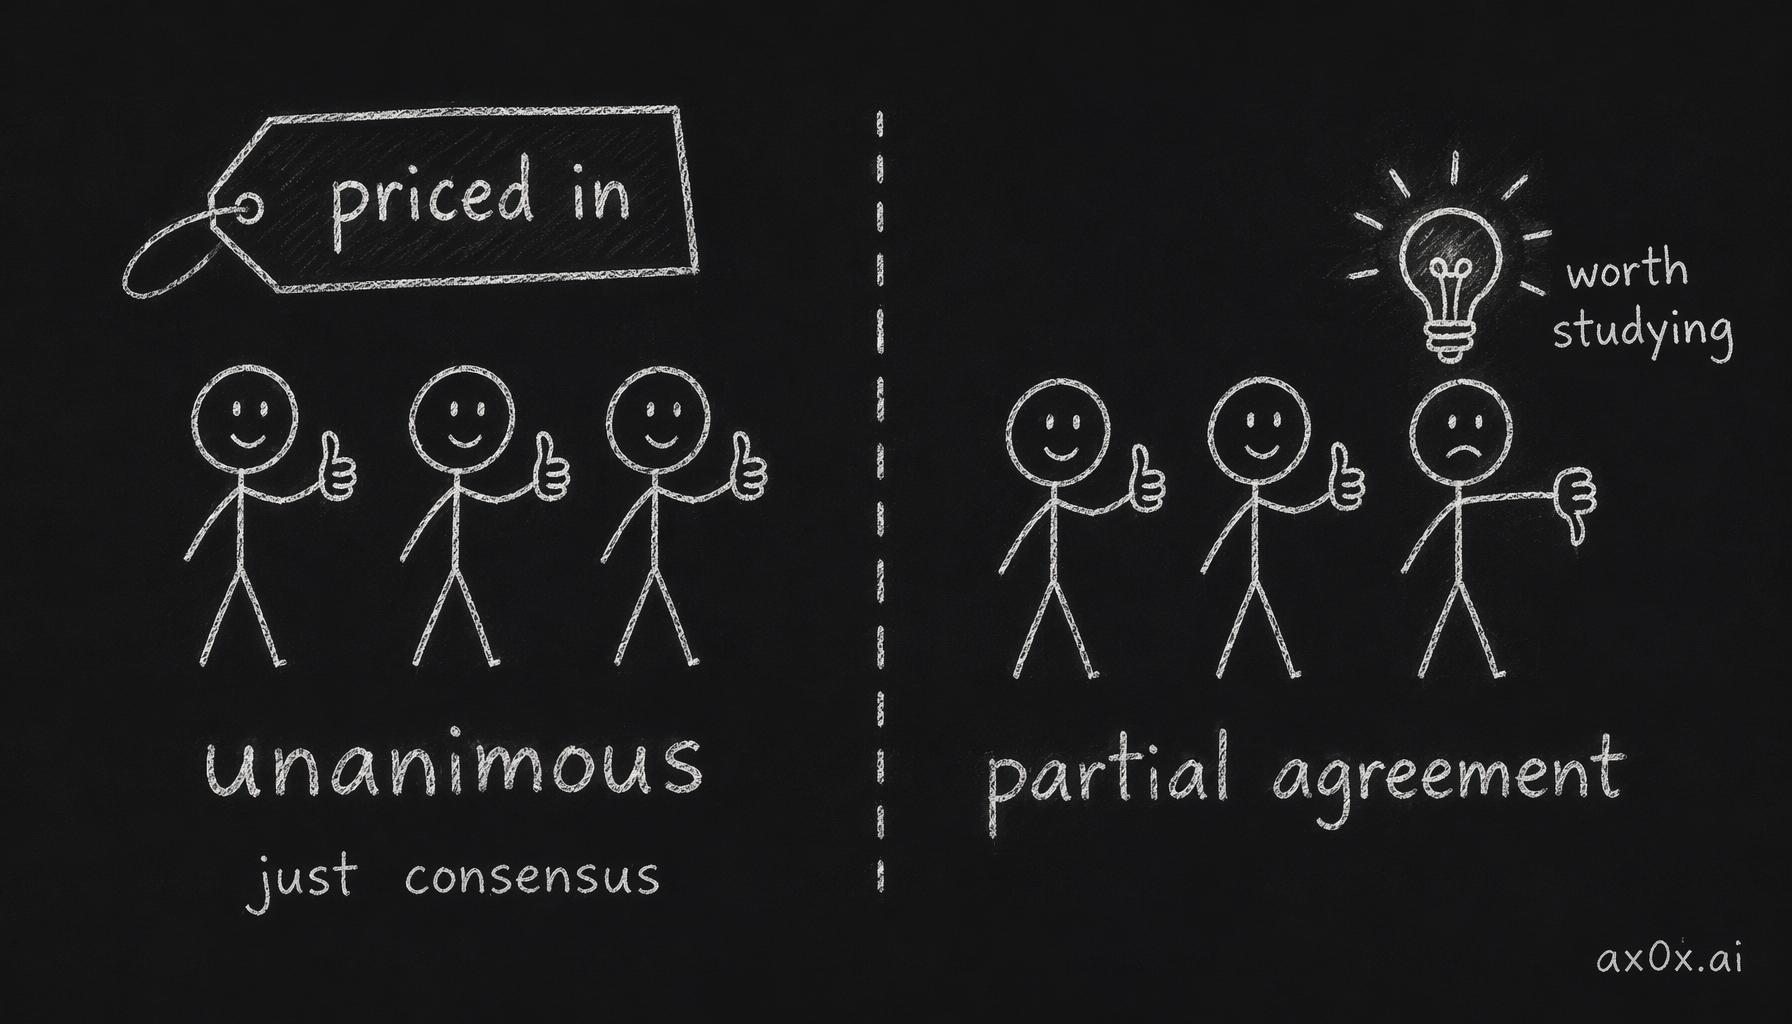 When all agents agree, it's usually just consensus already priced into the stock; the informative signal lives where they only partially agree.
Each agent has identified a different dimension of the problem. None of them is "right" — they are each right about the piece they focused on. Your job is integration: which dimension matters most for this specific investment at this specific price? That question cannot be answered by another agent. It requires judgment that draws on everything from Chapters 3 through 7, applied to a specific situation that no general framework fully covers.
This is why the fleet exists. Not to produce an answer. To produce a structured set of perspectives that forces you to think more precisely about what you actually believe and why.
9. Four failure modes of financial agents
General-purpose agents fail in general-purpose ways: hallucination, logical errors, instruction drift. Financial agents fail in all of those ways plus four domain-specific ways that are particularly dangerous because they produce outputs that look correct to anyone who is not specifically watching for them.
Failure mode 1 — Outdated data
Financial data changes quarterly. Agents' training data has a cutoff. When you ask an agent to analyze a company's financials, the agent may use numbers from its training data rather than the most recent filings — and it will not tell you which quarter it is referencing unless you ask.
This is not hallucination in the traditional sense. The numbers the agent provides were correct at some point. They are simply stale, and staleness in financial analysis can be catastrophic. A company that had $2 billion in cash last year might have $800 million today after an acquisition. An agent using last year's balance sheet will present a picture of financial strength that no longer exists.
Detection: Always specify the time period you want. "Pull the most recent quarterly filing" is better than "What are the company's financials?" Even better: verify the date of the data the agent provides. If the agent says "revenue was $12.4 billion" and the most recent 10-Q says $11.1 billion, the agent is using older data.
Mitigation: For any company you are seriously analyzing, pull the most recent quarterly filing yourself (it takes two minutes on SEC EDGAR or the company's IR page) and use those numbers as anchors. The agent's analysis should reference your anchors. If it does not, it is working from different data.
Failure mode 2 — Consensus blindness
This is the most insidious failure mode because it does not look like a failure. It looks like competent analysis.
Agents default to consensus views. When you ask "Is NVDA a good investment?", the agent synthesizes the dominant narrative: AI spending is growing, NVIDIA has a dominant position, data center revenue is accelerating. This is all true. It is also already reflected in a stock price that trades at a significant premium to historical multiples. The agent's analysis correctly identifies why the company is good. It fails to grapple with whether the current price already accounts for that goodness — which is the only question that matters for an investment decision.
Consensus blindness is especially dangerous because the agent's output is factually accurate. The revenue numbers are right. The growth trend is real. The competitive position is strong. The failure is not in the facts but in the framing: the agent presents well-known strengths as if they were insights, and omits the pricing question that would turn a company analysis into an investment analysis.
Detection: After reading any agent-produced analysis, ask: "Which of these observations would surprise a professional analyst who covers this stock?" If the answer is "none," the analysis has told you what everyone already knows. It might be useful as education. It is not useful as investment research.
Mitigation: Explicitly instruct the agent to address the pricing question: "Given these strengths, what would have to be true about future growth for the current stock price to be justified? Is that growth rate realistic?" This forces the agent out of narrative mode and into analytical mode.
Failure mode 3 — Fabricated sources
Agents sometimes cite specific reports, analyst notes, or data points that do not exist. This is a well-documented behavior, but it is particularly harmful in financial analysis because the outputs feel authoritative — "according to Morgan Stanley's Q3 2025 semiconductor outlook" — and verifying a specific analyst report is harder than verifying a number.
The fabrication is not malicious. The agent is generating text that pattern-matches with how financial analysis cites sources. But a fabricated source supporting a key claim in your thesis means your thesis rests on evidence that does not exist.
Detection: For any source the agent cites that you have not seen yourself, verify it. If the agent says "Goldman Sachs projects 35% revenue growth for 2027," check whether Goldman has published a note making that projection. If you cannot find the source, treat the claim as unsupported regardless of how specific the citation looks.
Mitigation: Instruct agents to distinguish between facts (verifiable from public filings), estimates (derived from specific stated assumptions), and general knowledge (broadly understood but not traceable to a single source). This will not eliminate fabrication, but it makes the agent more explicit about what it is doing, which makes fabrication easier to spot.
Failure mode 4 — Unit errors
The most mundane and the most costly. Revenue stated in millions when it should be in billions. Growth rates confused with absolute numbers. Percentages applied to the wrong base. Market cap confused with enterprise value.
An agent that says "revenue grew from $12 billion to $15 billion, a 25% increase" has made a calculation error — the increase is actually 25%, so in this case it happens to be right, but the same agent might say "revenue grew from $10 billion to $15 billion, a 25% increase" without catching the 50% actual growth rate. Or it might state a company's revenue as $45 billion when the actual figure is $45 million, and build an entire valuation on a number that is off by a factor of 1,000.
These errors are embarrassing when caught. They are expensive when not caught. And because the surrounding analysis is well-written and internally consistent, the wrong number gets absorbed into your mental model without triggering any alarm.
Detection: Before reading any agent analysis, look up three numbers yourself: revenue, market cap, and number of employees (or another size metric). These three numbers triangulate the company's scale. If the agent's analysis is off on any of them, everything built on that number is wrong.
Mitigation: Include a "sanity check" step in your workflow: after the analysis is produced, a separate agent verifies the five most important numbers against a specified data source. This catches the majority of unit errors, at the cost of one additional step per analysis.
10. Bloomberg still wins — and why that is fine
A fair assessment of agent-assisted investing requires acknowledging what it cannot do.
Bloomberg terminals provide proprietary data that is not publicly available: real-time institutional position changes, counterparty exposure data, analyst call transcripts, credit default swap pricing, and intraday order flow. These data sources represent genuine information advantages. No agent can replicate them because the data itself is behind a paywall that exists for commercial reasons.
Bloomberg's speed advantage is also real. In markets where trades execute in milliseconds, Bloomberg's data feeds arrive minutes or hours before the same information reaches public sources. For professional traders and institutions, this speed differential is worth the $24,000 annual license many times over.
Agents cannot replicate either advantage. They operate on public data with training cutoff delays. They are not real-time trading tools. Anyone who tells you that agents can replace a Bloomberg terminal is either selling you something or does not understand what Bloomberg actually provides.
Here is why this does not matter for what we are doing.
This curriculum is not training you to compete with institutional traders on speed or data access. It is training you to build investment judgment — the ability to read a company, form a thesis, stress-test it, and make a decision you can defend. For this purpose, public data is more than sufficient. The 10-K is public. The quarterly earnings release is public. The company's competitive position, margin structure, and capital allocation history are all derivable from public filings. The vast majority of long-term investment insight comes from thinking clearly about public information, not from having private information faster.
Peter Lynch made this point decades ago: individual investors have advantages that institutions do not — the ability to be patient, the freedom to concentrate, the lack of career risk from underperforming for a quarter. Those structural advantages remain, and agents amplify them. An individual investor with a three-agent fleet and sound judgment, working on a time horizon of years rather than quarters, is playing a different game from the Bloomberg terminal user. The games occasionally intersect on the same stocks, but the edges being exploited are fundamentally different.
The honest framing: agent-assisted investing is a training ground. You are building judgment, developing frameworks, and learning to ask better questions. If you do this for five years, you will have a level of investment literacy that would have previously required either working at a fund or spending thousands of hours on manual analysis. The agents compressed the access. The judgment still takes time. And that is fine, because the judgment compounds — each decision you make and review makes the next one slightly better calibrated.
Workshop — Design your fleet
Time: 60–90 minutes. Tools: Any AI agent you have been using through this curriculum. Output: A saved document — your fleet framework — that you will use in the Chapter 9 capstone.
Instructions
Step 1 — Choose the company. Use the same company from your Chapter 7 workshop, or the company you have been tracking since Chapter 1. Continuity matters — you want to see how fleet-based analysis changes your understanding of a company you have already formed opinions about.
Step 2 — Design a four-agent workflow. On paper or in a document, define four agent roles for researching this company. For each role, specify:
- Title. One or two words. (Example: "Financial Analyst," "Red Team," "Valuation Lead," "Risk Monitor.")
- Input. What does this agent receive? Be specific — "the company's last three 10-K filings" is better than "financial data."
- Output. What does this agent produce? Be specific — "a one-page summary of margin trends with three flagged anomalies" is better than "financial analysis."
- Handoff. Which agent receives this output next? Or does it go directly to you?
- Verification. How will you check whether this agent's output is reliable? (At least one agent should have an independent verification step.)
Step 3 — Execute the workflow. Run all four agents. Follow the handoff sequence you designed. When an agent produces output that surprises you, note it. When an agent produces output that confirms what you expected, note that too — confirmation is less informative than surprise.
Step 4 — Document what broke. Your designed workflow will not work perfectly the first time. Write down:
- Which handoff produced the most useful output?
- Which handoff produced output you did not actually use?
- Where did you intervene manually — and was the intervention because the agent failed, or because the workflow design was wrong?
- If you ran this again for a different company, what would you change?
Step 5 — Save the document. This is your fleet framework — version 1. You will use it in the Chapter 9 capstone, where you run the full end-to-end process for three companies. The framework will evolve. What matters now is that it exists and is based on actual experience rather than theory.
Why this workshop matters
Every chapter in this curriculum has included a workshop, and each has produced a document. Chapter 1 produced your first disagreement. Chapter 7 produced your first thesis. This chapter produces your first operational framework — the workflow you will use for every company analysis going forward.
The framework will not be perfect. It should not be. A perfect framework designed in advance is an abstraction. A flawed framework tested against reality is the beginning of a process that improves through use. The document you save today is not the answer. It is the starting point for a set of habits that compound over years.
What the fleet is actually for
The five patterns — delegation, verification, iteration, composition, failure detection — are tools. The three workflows are implementations. The four failure modes are hazards. None of them is the point.
The point is this: a fleet exists to produce structured disagreement that forces you to think more precisely about what you believe and why. The agents do not make the decision. They create the conditions under which a better decision becomes possible — by surfacing information you would have missed, challenging assumptions you would have left unexamined, and revealing contradictions you would have smoothed over.
The scarcest resource in investing is not data or analysis or even time. It is clarity about your own reasoning. A well-designed fleet is a mirror that reflects the quality of your questions back at you. Ask vague questions and the fleet produces consensus summaries. Ask precise questions and the fleet produces material you can actually use.
Every improvement in your fleet design is, in the end, an improvement in the precision of your questions. And the precision of your questions is the thing that compounds.
The capstone workshop uses everything from Chapters 1 through 8. Bring your thesis from Chapter 7, your fleet framework from this chapter, and three companies you are willing to spend a full day analyzing. The capstone is not a reading chapter — it is the exam.