Reading a Company — Patterns, Not Pages
Chapter 4 of 10 in the AI-Native Investor curriculum.
Enron's 2000 10-K filing was 308 pages. Every red flag that would eventually explain the fraud was in the document — related-party transactions with entities controlled by the CFO, off-balance-sheet debt structures that kept billions in liabilities invisible, revenue recognition practices that booked multi-year contract value upfront. The numbers were technically disclosed. Thousands of professional analysts received the same filing. A handful of short sellers — Jim Chanos, most famously — read the same pages everyone else read and reached a different conclusion. Not because they read more carefully, but because they were looking for different patterns.
This is the core skill of Chapter 4. You are not going to become an accountant. You are not going to memorize line items. You are going to learn what shapes to look for across three financial statements — shapes that reveal business structure, fragility, and the gap between what a company says and what its cash register confirms.
An agent can read a 10-K in seconds and summarize every section. That is not the bottleneck. The bottleneck is knowing which summary to trust, which number to double-check, and which pattern — invisible in any single line item — emerges only when you look at the whole picture.
What this chapter covers
- Why pattern recognition, not page-by-page reading
- Lens one — the income statement reveals business structure
- Lens two — the balance sheet reveals fragility
- Lens three — the cash flow statement reveals truth
- Three signal categories: green, yellow, red
- Case study: Enron — what the shapes looked like before the collapse
- Case study: Costco vs. Walmart — the same industry, different shapes
- Case study: stock compensation and the tech earnings illusion
- Using agents as readers — what to ask for and what to verify yourself
- Trade-off: what pattern recognition misses
- Workshop: three-lens comparison
1. Why pattern recognition, not page-by-page reading
Benjamin Graham's advice to read the 10-K was correct in 1949 and is correct in 2026. What changed is what "reading" means when you have an agent that can ingest the entire document in seconds.
The old approach: spend eight hours reading a 10-K cover to cover, annotating as you go. You absorb everything. You also lose the signal in the noise — the footnote about pension obligations competes for attention with the boilerplate about risk factors that every company in the industry copies verbatim.
The new approach: the agent reads every line. You look at the shapes the numbers make. Three financial statements, each answering a different question:
- The income statement answers: what does this business actually do, and how efficiently?
- The balance sheet answers: how fragile is this business if something goes wrong?
- The cash flow statement answers: is the business generating real cash, or is the profit an accounting construction?
These are three lenses on the same company. Each reveals something the others hide. A company can look profitable on the income statement while bleeding cash on the cash flow statement. A company can look solvent on the balance sheet while carrying debt that matures next year with no plan to refinance. The discipline is looking through all three lenses and noticing where they disagree.
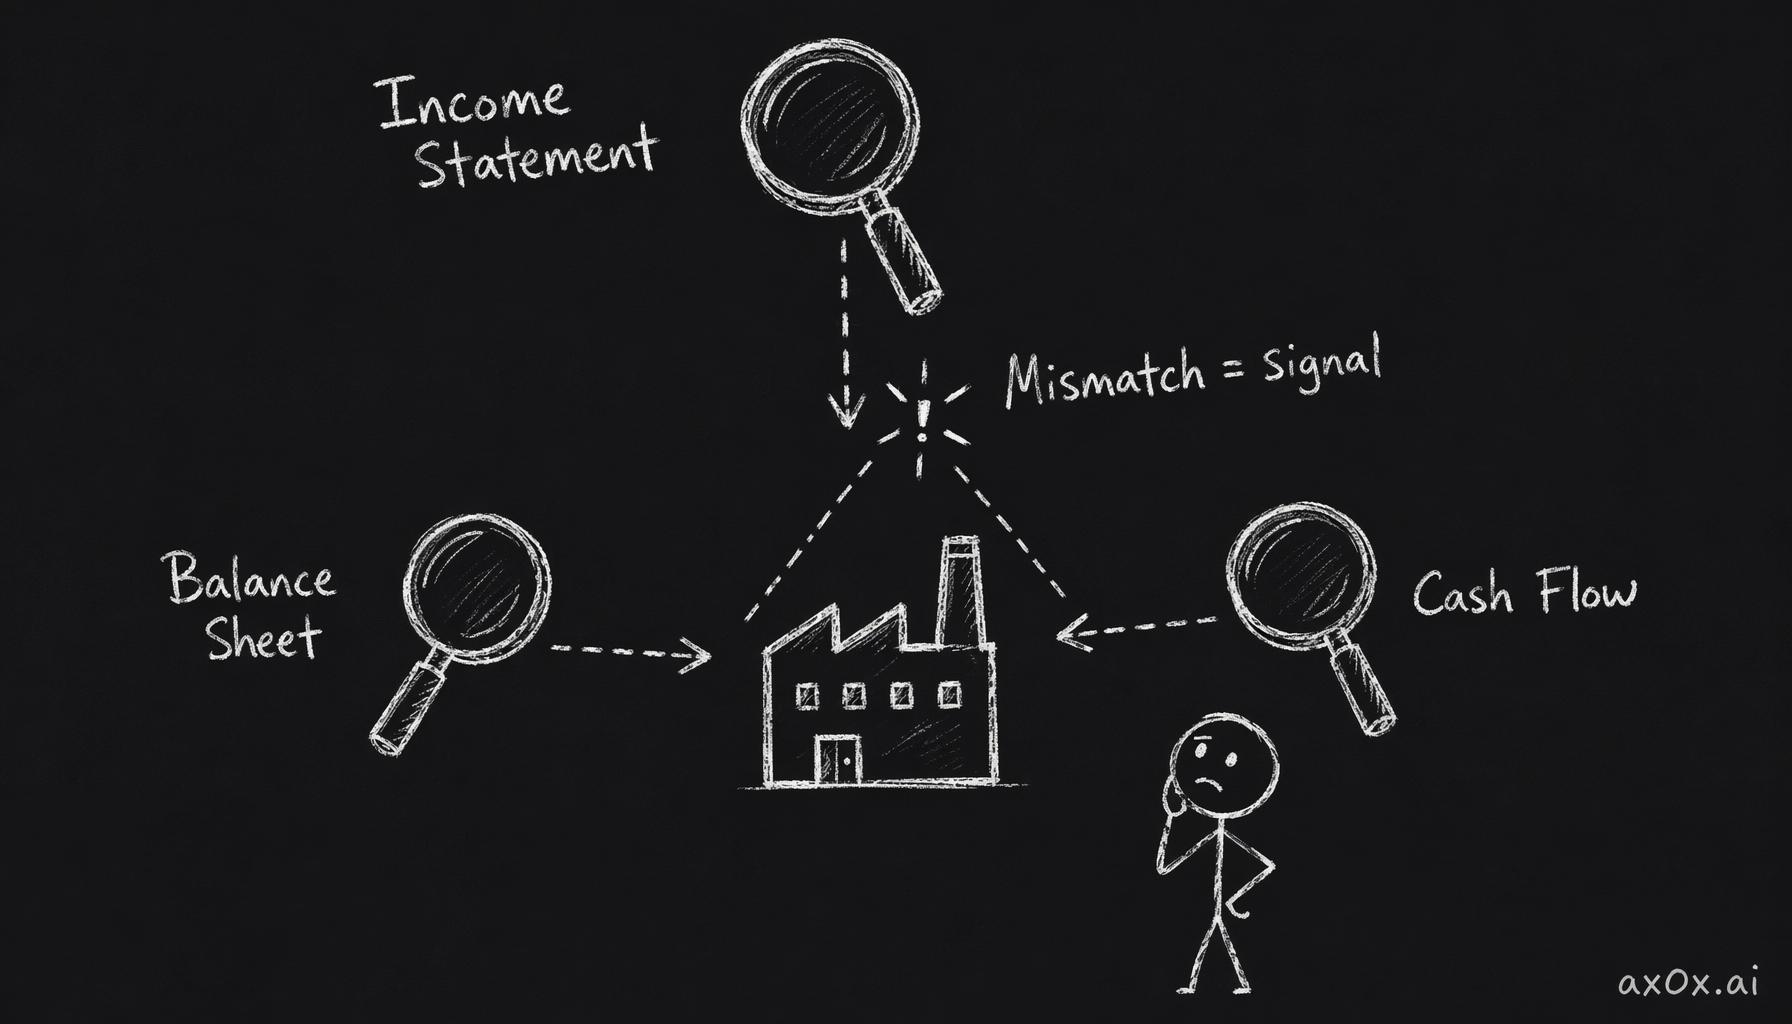 Three financial statements act as three lenses on one company; where the readings disagree is the real signal
Buffett has said that he reads the 10-K to understand the business, not to understand the accounting. The accounting is the medium. The business is the message. This chapter teaches you to extract the message — the structural patterns — without getting trapped in the medium.
What "reading" means now
In practice, this is what the workflow looks like:
You ask an agent to pull five years of financials for a company and flag meaningful changes in margins, debt structure, and cash flow quality. The agent returns a structured summary. You do not read the 10-K yourself — the agent did that. What you do is look at the output and ask: do these three lenses tell a consistent story, or do they contradict each other?
When they contradict each other, you have found something interesting. That contradiction — profit rising while cash flow falls, or revenue growing while margins compress — is where the investment question actually lives.
2. Lens one — the income statement reveals business structure
The income statement is the most intuitive of the three. Revenue at the top, expenses in the middle, profit at the bottom. Most people start and stop here. That is a mistake, but not because the income statement is useless — it is because most people read it too narrowly. They look at profit. The shapes that matter are in the margins, the composition, and the trends.
Gross margin as a moat indicator
Gross margin — revenue minus the direct cost of producing the product or service — is one of the most reliable indicators of competitive position.
A company with 70% gross margins is selling something that costs far less to produce than what customers pay for it. That spread can come from brand power (Apple), network effects (Visa), switching costs (Adobe), or intellectual property (pharmaceutical patents). A company with 15% gross margins is selling something close to commodity pricing — the customer could buy roughly the same thing from someone else, and the company has limited ability to raise prices.
The number itself matters less than its trajectory. Gross margin expanding over five years suggests the company is gaining pricing power or reducing costs faster than it is reducing prices. Gross margin compressing suggests competition is forcing prices down, costs are rising, or the company is buying revenue by discounting.
Costco operates at roughly 13% gross margin. Walmart operates at roughly 24%. Costco's gross margin is lower by design — the entire business model is selling at near-cost and making money on membership fees. This is not a weakness. It is a structural choice that creates a different kind of moat. We will return to this comparison in Section 7.
Revenue composition and customer concentration
A single number for revenue tells you almost nothing. The composition tells you everything.
What percentage of revenue is recurring versus one-time? A company with 80% recurring revenue (subscriptions, maintenance contracts, licensing fees) has much more predictable cash flows than a company with 80% project-based revenue. Predictability is not a guarantee of quality — the recurring revenue could be declining — but it is a structural feature that affects how you should value the company and what risks matter most.
Where does the revenue come from geographically? A company with 90% of revenue from one country is exposed to that country's regulatory environment, currency, and economic cycle. A company with revenue spread across six regions has different risks — currency translation, geopolitical complexity — but is less likely to be destroyed by a single regulatory change.
How concentrated is the customer base? If one customer represents 25% of revenue, losing that customer is an existential risk. This information is required to be disclosed in the 10-K if a single customer exceeds 10% of revenue. An agent will flag it. Your job is to think about what happens if that relationship changes.
Operating margin tells you about discipline
Operating margin is what remains after the company pays for everything it takes to run the business — not just producing the product, but selling it, managing it, and developing new versions of it.
The gap between gross margin and operating margin reveals how much of the competitive advantage is consumed by operations. A company with 70% gross margins and 15% operating margins is spending heavily — on sales teams, on R&D, on administration. That spending could be investment in growth (justified) or structural bloat (dangerous). The distinction matters, and the income statement alone cannot tell you which one it is. You need the other two lenses.
Operating margin expanding while revenue grows is a strong signal — the business is scaling efficiently. Operating margin shrinking while revenue grows means the company is spending more than a dollar to capture each new dollar of revenue. That can be rational for a fast-growing company investing in future market share. It can also be a sign that the business model does not actually scale. The trend over three to five years is more informative than any single year.
What the income statement hides
The income statement's biggest blind spot is that it follows accrual accounting, not cash accounting. Revenue is recorded when earned, not when cash is collected. Expenses are recorded when incurred, not when paid. This means a company can report strong earnings while its bank account is shrinking — because customers have not paid yet, or because the company is capitalizing expenses that should be recognized immediately.
This is not a flaw in the income statement. It is the reason the cash flow statement exists. We will get there in Section 4.
3. Lens two — the balance sheet reveals fragility
The balance sheet is a snapshot: what does the company own (assets), what does it owe (liabilities), and what is left over for shareholders (equity)? Unlike the income statement, which covers a period of time, the balance sheet captures a single moment.
Most investors glance at the balance sheet for the debt number and move on. The patterns that matter are subtler.
Debt trajectory matters more than debt level
A company with $10 billion in debt is not necessarily more fragile than a company with $1 billion in debt. What matters is the debt relative to the company's ability to service it, and the direction it is moving.
The debt-to-equity ratio is a starting point. A company with a debt-to-equity ratio of 0.5 has borrowed fifty cents for every dollar of shareholder equity. A company with a ratio of 3.0 has borrowed three dollars for every dollar of equity. High leverage amplifies returns in good times and accelerates destruction in bad times. But the ratio on its own tells you less than the five-year trend.
Debt rising while earnings are flat is a warning. The company is borrowing to maintain the appearance of health — funding dividends, buybacks, or operations with borrowed money. Debt falling while earnings are rising is the opposite signal — the company is strengthening its foundation. Debt rising while earnings are also rising can be fine, depending on the rate — a company investing borrowed capital at returns above its cost of debt is creating value.
The maturity wall
Not all debt is created equal. A company with $5 billion in debt due in ten years is in a fundamentally different position than a company with $5 billion in debt due next year.
The maturity schedule — when each tranche of debt comes due — is one of the most overlooked patterns on the balance sheet. A "maturity wall" exists when a large amount of debt matures in a short period. The company must either pay it off (requires cash), refinance it (requires willing lenders at acceptable rates), or default.
During normal credit markets, refinancing is routine. During credit crunches — 2008, early 2020, the periods when credit markets seize — refinancing becomes expensive or impossible. Companies with maturity walls during credit crunches fail, not because their business is bad, but because they cannot roll their debt. This is a fragility pattern that does not show up on the income statement at all.
An agent can pull the debt maturity schedule from the 10-K footnotes. The question you need to ask is: what happens if credit markets close for twelve months right before this debt matures?
Hidden liabilities
The balance sheet shows recognized liabilities. Some of the most dangerous obligations are not on the balance sheet at all — or are buried in footnotes.
Operating leases were off-balance-sheet until 2019 (ASC 842 brought them onto the balance sheet, but the transition is still incomplete in some sectors). Pension obligations can be massive and are sensitive to discount rate assumptions — a small change in the assumed rate can swing the liability by billions. Contingent liabilities — pending lawsuits, environmental remediation, product warranties — are disclosed in footnotes but not recognized until they become probable.
Enron's most dangerous liabilities were in entities structured specifically to keep them off the balance sheet. The technical details were complex, but the pattern was simple: the balance sheet looked healthier than reality because significant obligations were hidden. We will return to this in Section 6.
Goodwill as a tell
When a company acquires another company for more than the acquired company's net assets are worth, the difference is recorded as goodwill. Goodwill is an intangible asset that sits on the balance sheet indefinitely — until the company admits the acquisition was not worth what it paid, at which point goodwill is "impaired" (written down).
A company with goodwill representing 40% or more of total assets has made large acquisitions and has not yet admitted to overpaying. That does not mean the acquisitions were bad — Alphabet's acquisition of YouTube generated extraordinary value, though the goodwill accounting barely captures it. But a high goodwill percentage combined with declining returns on invested capital is a pattern worth flagging: the company may be an empire-builder that destroys value through acquisitions.
What the balance sheet hides
The balance sheet is a snapshot, not a movie. It tells you what exists at one moment but not how fast things are changing. A company can have a strong balance sheet on December 31 and a weak one by February because of seasonal patterns, one-time events, or deliberate timing of transactions to "window dress" the year-end numbers.
More fundamentally, the balance sheet values assets at historical cost (with some exceptions for fair-value accounting). A piece of real estate bought in 1985 for $10 million might be worth $200 million today, but the balance sheet still shows $10 million (less depreciation). Conversely, a software platform that the company spent $500 million developing might be worth nothing if the market moved on — but the balance sheet still shows it as an asset.
The balance sheet tells you what the company paid for its assets, not what they are worth. For that, you need judgment.
4. Lens three — the cash flow statement reveals truth
If the income statement is what the company says happened and the balance sheet is what the company says it owns, the cash flow statement is what the bank account confirms. Cash is harder to manipulate than earnings. Not impossible — there are techniques — but harder.
Aswath Damodaran calls cash flow the "reality check" on the income statement. The income statement tells you what the company earned under accounting rules. The cash flow statement tells you how much cash actually moved.
The three sections of the cash flow statement
Operating cash flow is cash generated by the core business. This is the number that matters most. A company that consistently generates positive operating cash flow is producing real economic value. A company that reports profits but generates negative operating cash flow is producing accounting value — which is a polite way of saying the profits might not be real.
Investing cash flow is cash spent on (or received from) long-term assets — property, equipment, acquisitions, and investments. This section is typically negative for growing companies, because growth requires investment. A company with consistently positive investing cash flow is selling assets, which can be a sign of downsizing or desperation.
Financing cash flow shows cash from borrowing, issuing stock, paying dividends, and buying back shares. This section tells you how the company funds itself and rewards shareholders.
Operating cash flow versus net income — the truth ratio
The single most important pattern on the cash flow statement is the relationship between operating cash flow and net income over time.
Healthy companies generate operating cash flow that meets or exceeds net income. The ratio — operating cash flow divided by net income — should be at or above 1.0 consistently. When it falls below 1.0, the company is reporting profits it has not collected in cash. Sometimes there are legitimate reasons (a large contract with delayed payment terms, for example). But a persistent gap — net income consistently exceeding operating cash flow — is one of the clearest warnings in financial analysis.
Enron reported net income of $979 million in 2000. Its operating cash flow was negative. That single discrepancy, visible to anyone who looked, was the clearest signal that the reported profits were not real. We will walk through exactly how this showed up in Section 6.
Free cash flow — what is left after maintenance
Free cash flow is operating cash flow minus capital expenditures — the cash the business generates after paying to maintain its operations. This is the cash available for dividends, buybacks, debt repayment, or reinvestment in growth.
A company can report strong earnings and even strong operating cash flow while generating negative free cash flow — because the capital expenditures required to maintain the business consume everything. Capital-intensive businesses (airlines, telecom, manufacturing) often show this pattern. It does not make them bad businesses, but it means their reported earnings overstate the cash actually available to shareholders.
The free cash flow conversion rate — free cash flow divided by net income — is a more honest measure of earnings quality than net income alone. A company converting 80-100% of net income into free cash flow has high-quality earnings. A company converting 30% has earnings that look better than the underlying cash reality.
Working capital as a signal
Working capital — current assets minus current liabilities — is the cash tied up in day-to-day operations. Inventories, receivables (money customers owe), and payables (money the company owes suppliers) are the main components.
The pattern to watch is the direction. Working capital requirements increasing faster than revenue means the business is tying up more cash to generate each dollar of sales. This is a drag on cash flow that does not show up on the income statement. It can mean customers are paying more slowly (bad sign — possible credit quality issues), inventory is building up (bad sign — possible demand weakness), or the company is paying suppliers faster than it is collecting from customers.
Walmart and Costco both run negative working capital — meaning they collect from customers before they pay suppliers. This is an enormous structural advantage. It means the business operations themselves generate cash, rather than consuming it. Companies with negative working capital are being financed by their suppliers, which is one of the most efficient capital structures possible.
Stock-based compensation and the cash flow illusion
This pattern is specific to the technology sector, but it is important enough to flag here and expand on in Section 8.
Stock-based compensation (SBC) is a real cost to shareholders — it dilutes their ownership. But it does not require cash. Under current accounting rules, SBC is subtracted from earnings on the income statement (reducing net income) but added back on the cash flow statement (because it is a non-cash expense). This means companies with heavy SBC show operating cash flow that is significantly higher than economic reality.
A technology company reporting $5 billion in operating cash flow and $2 billion in stock-based compensation is generating $3 billion in cash flow after accounting for the real cost of employee compensation. The $5 billion number is the one that gets reported in headlines and agent summaries. The $3 billion number is closer to reality.
This is not fraud. It is not even aggressive accounting. It is a known feature of how the cash flow statement works. But if you do not adjust for it, you will systematically overvalue technology companies with high SBC — which is most of them.
What the cash flow statement hides
Cash flow is harder to manipulate than earnings, but not impossible.
A company can boost operating cash flow by delaying payments to suppliers (stretching payables), accelerating collections from customers (factoring receivables), or reclassifying investing cash flows as operating cash flows. Worldcom reclassified operating expenses as capital expenditures, which simultaneously boosted both operating income and operating cash flow — a fraud that was eventually caught, but not immediately.
The cash flow statement also hides the quality of the cash flow's source. Operating cash flow from a one-time insurance settlement is not the same as operating cash flow from selling products, but both show up in the same line.
No single statement tells the full truth. The discipline is reading all three together.
5. Three signal categories: green, yellow, red
Not every pattern carries the same weight. Some indicate strength, some warrant investigation, and some demand immediate skepticism. Here is a framework for categorizing what you find.
Green signals — structural strength
- Gross margins stable or expanding over five years. The company is maintaining or increasing pricing power. Competition has not forced commoditization.
- Operating cash flow consistently exceeds net income. Earnings are real. Cash is arriving.
- Free cash flow positive and growing. The business generates more cash than it needs to maintain itself, and that surplus is increasing.
- Debt declining or stable relative to earnings. The company is not borrowing to survive.
- Working capital requirements stable or improving. The business is not tying up progressively more cash to operate.
- Revenue composition diversifying. Customer concentration decreasing, geographic exposure broadening, recurring revenue growing as a share of total.
None of these signals alone means "buy." A company can show all six green signals and still be overvalued. What these signals tell you is that the business is structurally healthy — the foundation is sound. Whether the price is right is a Chapter 5 question.
Yellow signals — investigate further
- Gross margins declining slowly. Could be competitive pressure, could be a deliberate strategic shift (Costco-style low-margin growth). Requires context.
- Operating cash flow below net income in one or two years, but not persistently. Could be a timing issue — a large contract with delayed payment, a one-time working capital spike. Requires looking at the specific cause.
- Debt increasing, but earnings are increasing faster. Leverage is rising, but the company may be deploying borrowed capital productively. Requires checking what the debt is funding.
- Goodwill increasing as a percentage of total assets. The company is making acquisitions. Some acquisitions create extraordinary value. Most do not. Requires looking at the returns on invested capital post-acquisition.
- Revenue growing but margins flat or compressing. The company is buying revenue, possibly through discounts, promotions, or low-margin product lines. Could be a growth investment. Could be desperation.
Yellow signals are not warnings. They are questions. The difference between a good investor and a mediocre one is the willingness to investigate yellow signals instead of ignoring them or panic-selling.
Red signals — approach with extreme skepticism
- Operating cash flow persistently below net income. The company is reporting profits it is not collecting. This is the single most reliable red flag in financial analysis.
- Debt increasing while earnings are flat or declining. The company is borrowing to maintain the appearance of health. This path ends in restructuring or default.
- Revenue recognition changes or restatements. If the company changes how it counts revenue, the question is always: does the new method make the numbers look better? If yes, skepticism is warranted.
- Related-party transactions with entities controlled by management. This was the core of Enron's fraud. When management is doing business with entities they control, the opportunity for self-dealing is enormous.
- Growing gap between reported earnings and cash taxes paid. Some gap is normal (deferred tax assets, timing differences). A growing gap over multiple years suggests aggressive accounting — the company is reporting higher earnings to shareholders than it is reporting to the tax authority.
- Footnote complexity increasing year over year. Companies with something to hide tend to bury it in increasingly complex footnote disclosures. The footnotes get longer, the language gets more opaque, and the structures get more convoluted. This is not a quantitative signal, but it is a reliable qualitative one.
Red signals do not mean "sell immediately." They mean the company has a higher burden of proof. If you cannot explain why the red signal is benign — with specific evidence, not hand-waving — the prudent response is to either avoid the company or size the position small enough that you can afford to be wrong.
6. Case study: Enron — what the shapes looked like before the collapse
Enron is the most studied corporate fraud in history. It is worth studying not because the fraud was sophisticated — in hindsight, the patterns were remarkably clear — but because thousands of professional analysts missed what was visible in the public filings.
The income statement view
Enron's revenue grew from $31 billion in 1998 to $101 billion in 2000. That growth rate — more than tripling in two years — was itself a yellow signal. Revenue growing at 70%+ annually in an energy company is unusual enough to warrant investigation.
More telling was the margin structure. Despite the explosive revenue growth, operating margins were thin and declining. Enron's operating margin in 2000 was approximately 2%. For comparison, Duke Energy and Southern Company — traditional utilities that Enron claimed to have transcended — operated at margins of 15-20%.
The pattern: massive revenue, razor-thin margins. This is the shape of a trading operation, not an infrastructure company. Enron told the market it was building the energy platform of the future. Its income statement told a different story — that it was primarily a trading firm booking the gross value of trades as revenue rather than the net spread.
This distinction matters enormously. A platform company with 70% margins can sustain a premium valuation because each incremental dollar of revenue generates substantial profit. A trading company with 2% margins needs enormous volume to generate meaningful profit, and the volume is fragile — it can disappear in a single quarter of market dislocation.
The balance sheet view
Enron's balance sheet had two critical patterns.
First, debt was rising faster than the business could support. Total debt grew from $7.4 billion in 1998 to $10.2 billion in 2000. On its own, not alarming for a company of Enron's stated size. But the debt was funding entities that kept liabilities off the consolidated balance sheet — the infamous special purpose entities (SPEs) managed by CFO Andrew Fastow. The disclosed related-party transactions in the 10-K footnotes described deals between Enron and entities that Fastow personally controlled. This was a red signal — management doing business with itself is one of the clearest fraud indicators.
Second, goodwill and intangible assets made up a growing share of total assets. Enron was acquiring companies and recording the premium as goodwill, but the returns on those acquisitions were not materializing. Assets were growing. Cash returns were not.
The cash flow view
This is where the picture becomes unambiguous.
Enron reported net income of $979 million in 2000. Its operating cash flow was approximately negative $90 million. The company reported nearly a billion dollars in profit and generated no cash. This single fact — visible on page one of the cash flow statement — contradicted the entire earnings narrative.
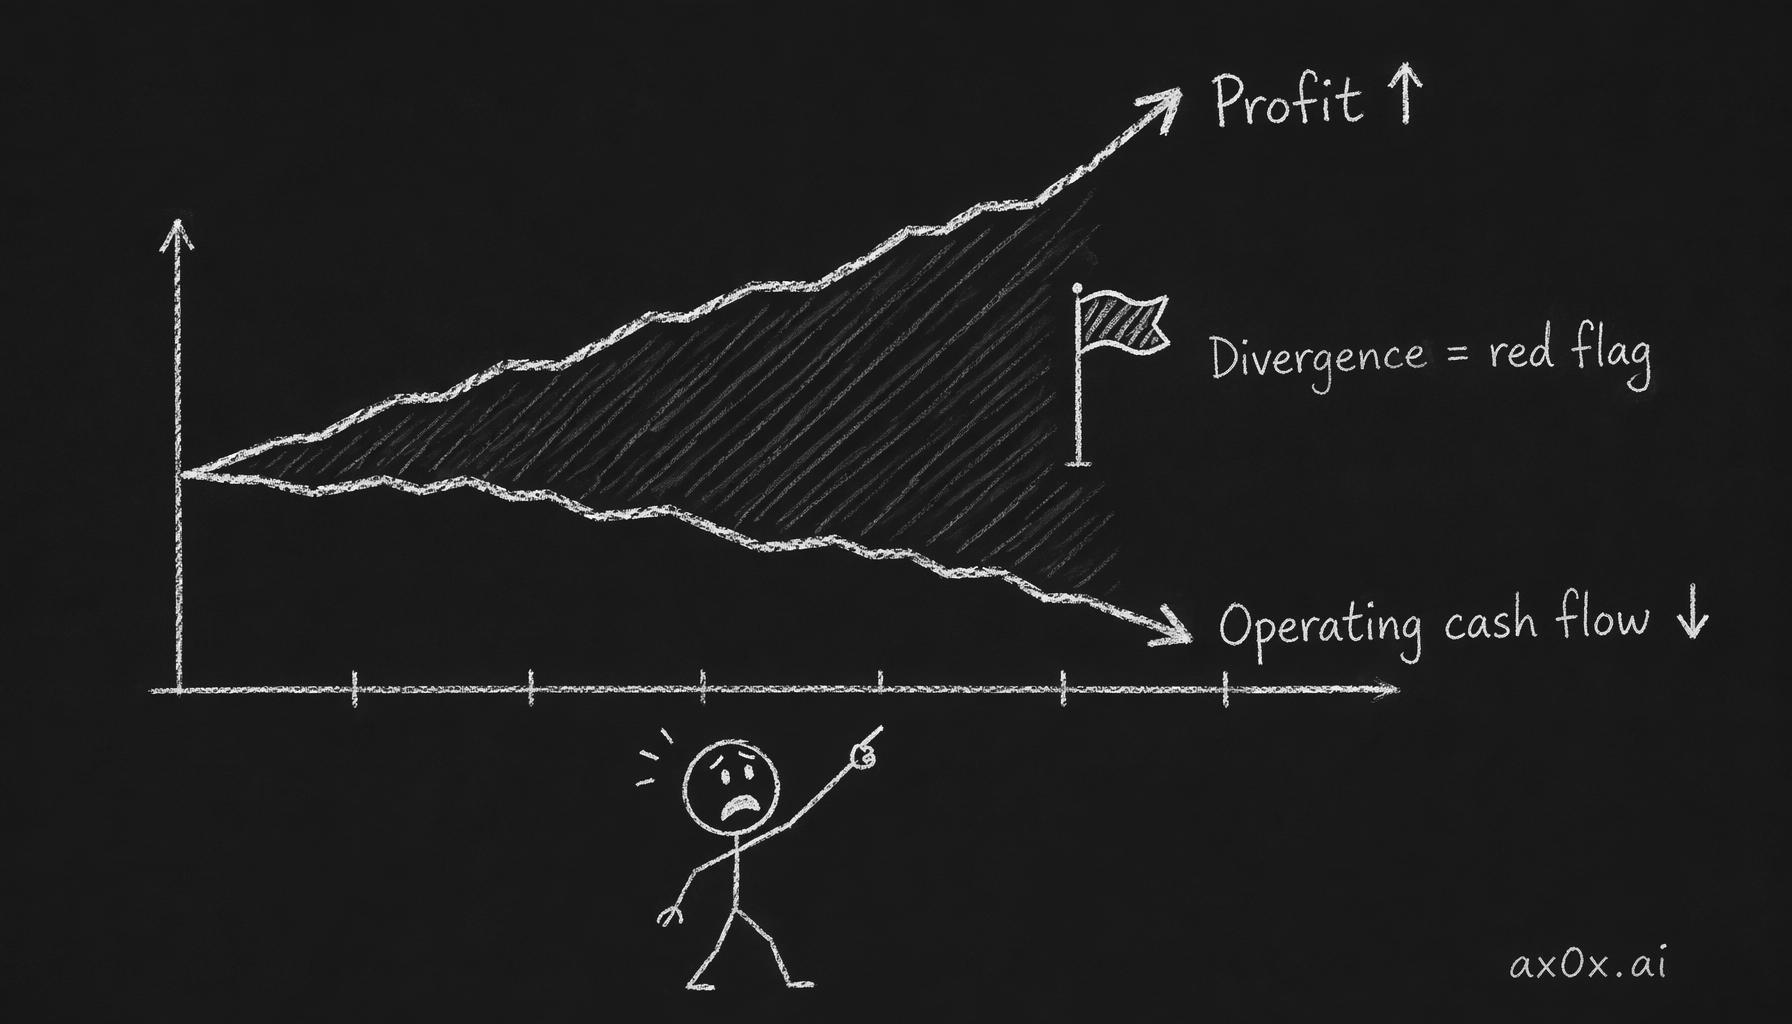 Profit line rises while operating cash flow falls; the widening gap between them is the Enron-style red flag
Where was the cash going? Working capital was consuming enormous amounts of cash. Receivables were growing faster than revenue — suggesting customers were not paying, or that the "revenue" was being booked against entities that would never pay. Inventory and other current assets were ballooning, requiring cash to fund.
Meanwhile, financing cash flow was positive — Enron was borrowing and issuing stock to fund operations. A company borrowing money to fund day-to-day operations while reporting record profits is the financial equivalent of a person paying their rent with credit cards while telling friends they just got a raise.
The three-lens verdict
Income statement: growing revenue, collapsing margins. Yellow. Balance sheet: rising debt, off-balance-sheet entities, related-party transactions. Red. Cash flow: profits without cash. Red.
Any one of these might have an innocent explanation. All three together form a pattern that is very difficult to explain innocently. Jim Chanos did not need inside information to short Enron. He needed to look at the shapes.
The lesson
The lesson is not "you would have caught Enron." That would be self-flattering and dishonest. Chanos had decades of experience in forensic accounting. The lesson is that the signals were in the public filings, and the framework for reading them is learnable. You are not trying to catch the next Enron. You are trying to develop enough pattern recognition to avoid the obvious traps — and to know when you need to ask harder questions.
7. Case study: Costco vs. Walmart — the same industry, different shapes
Enron is a fraud case. It teaches you what broken looks like. Costco and Walmart teach something more nuanced: what different strategic choices look like through the three lenses.
Both are retailers. Both sell physical goods. Both operate at enormous scale. Their financial shapes are fundamentally different because their business models are fundamentally different — and the differences are visible in the patterns.
The income statement comparison
Walmart's gross margin: approximately 24%. Costco's gross margin: approximately 13%.
A surface-level reading says Walmart is more profitable. A pattern-level reading asks: why is Costco's margin so low, and is that a weakness or a choice?
Costco's model is built on pricing discipline. The company has an internal rule — frequently confirmed by management — that no branded item is marked up more than 14% and no private-label (Kirkland) item more than 15%. This is not competitive pressure. It is a deliberate constraint. The purpose is to make the membership valuable enough that customers renew at rates above 90%.
Costco's membership fee revenue in its most recent fiscal year was approximately $4.8 billion. That revenue has close to 100% margins — there is almost no incremental cost to collecting a membership fee. When you combine the thin product margins with the high-margin membership revenue, Costco's actual operating margin is comparable to Walmart's.
But the shapes are different. Walmart's profit comes from product margins — it buys goods and sells them at a markup. Costco's profit comes primarily from membership fees — it sells goods at near-cost and charges for access.
This distinction matters for durability. Walmart's margins are vulnerable to any competitor who can offer lower prices. Costco's membership revenue is vulnerable only to a competitor who can make the membership less valuable — which requires offering comparable quality and selection at comparable or lower prices, which requires comparable scale, which requires decades of investment. The membership model creates a moat that product-margin competition cannot easily breach.
The balance sheet comparison
Both companies carry moderate debt relative to their earnings. Neither has a fragility problem. The interesting pattern is elsewhere.
Costco's inventory turnover — how many times it sells and replaces its entire inventory per year — is approximately 12 times. Walmart's is approximately 8-9 times. This means Costco's products sit on shelves for roughly 30 days before being sold. Walmart's sit for roughly 40-45 days.
This is not a minor operational detail. Higher inventory turnover means less cash tied up in inventory, lower risk of obsolescence (critical for food), and stronger negotiating position with suppliers. A supplier knows that a product placed in Costco will sell faster than the same product in most other retailers. That knowledge gives Costco leverage in negotiating purchase prices — which it passes to members through lower shelf prices — which keeps membership renewal rates above 90% — which funds the entire model.
The pattern is circular and self-reinforcing. High turnover → lower prices → higher membership value → higher renewal → more members → more volume → higher turnover. This loop is visible in the financial statements if you know to look for it.
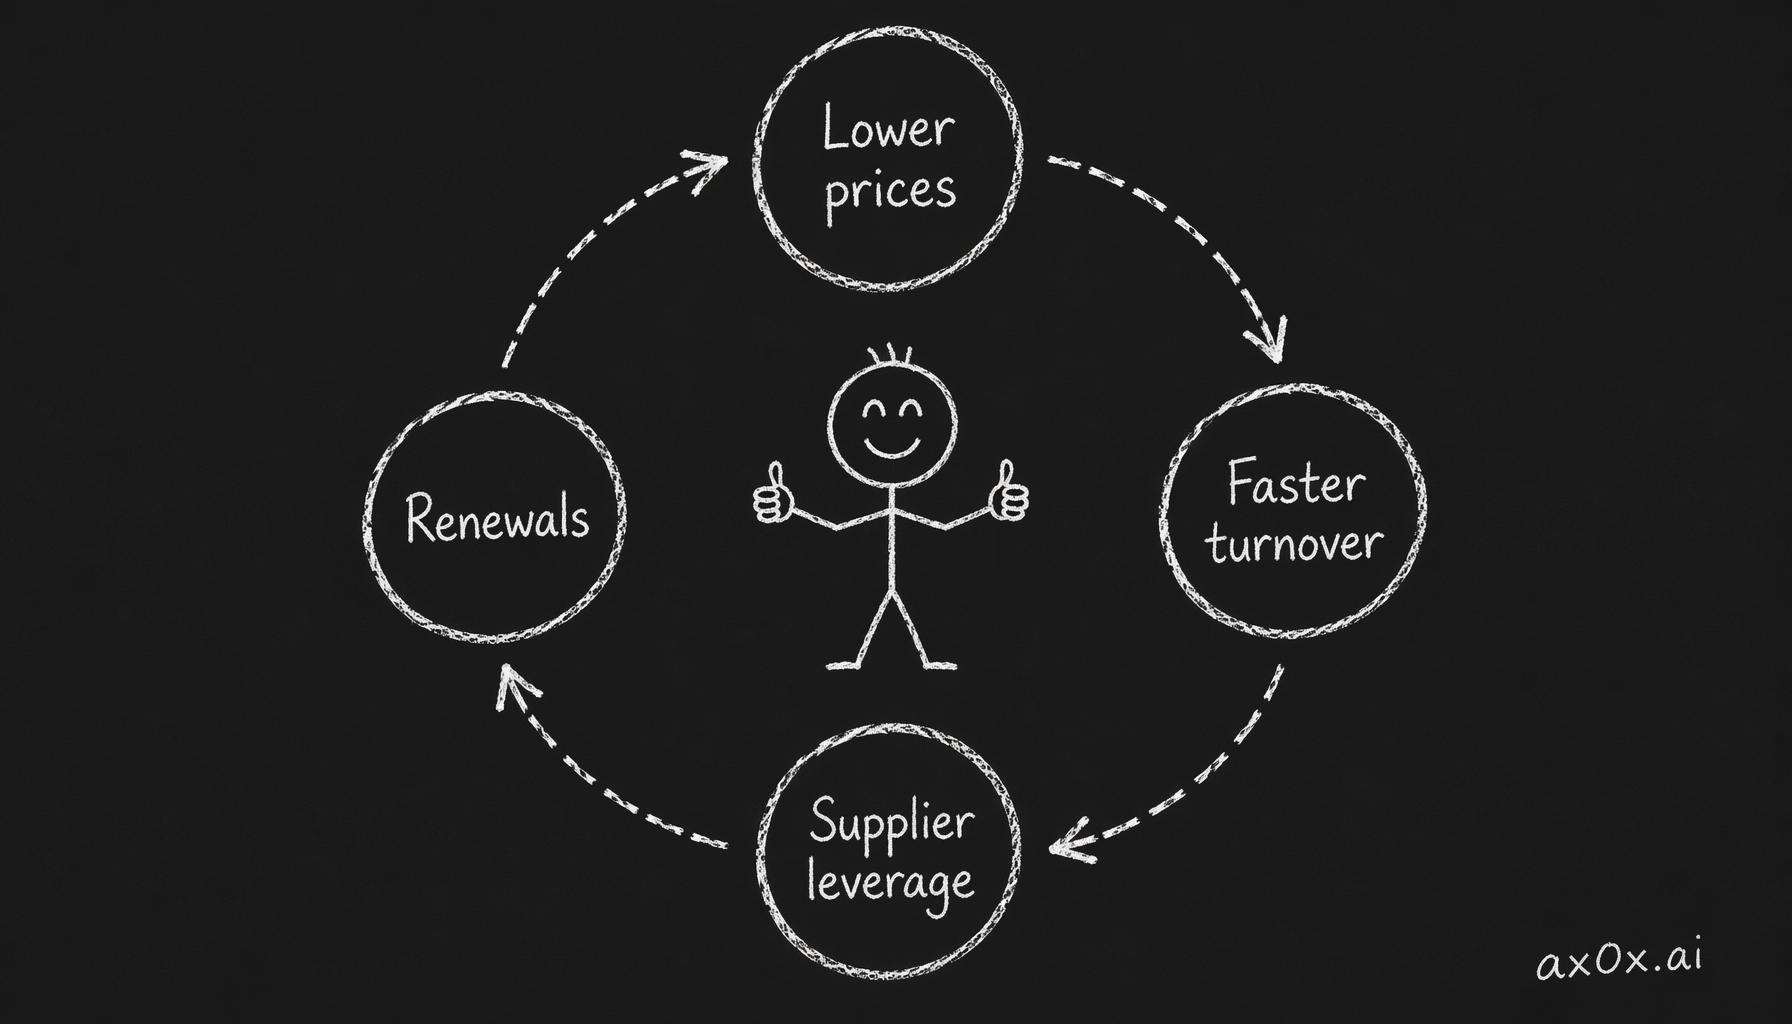 Lower prices drive faster turnover, stronger supplier leverage and higher renewals — a four-step self-reinforcing flywheel
The cash flow comparison
Both companies generate strong free cash flow. The structural difference is in working capital.
Both Costco and Walmart operate with negative working capital — they collect from customers (cash and card payments at checkout) before they pay suppliers (typically 30-60 day payment terms). This means their operations generate cash rather than consuming it. The faster the inventory turns, the more pronounced this effect.
Costco's negative working capital is more extreme because of its higher turnover. It sells the product, collects payment, and has days or weeks before it owes the supplier. During that window, it is effectively borrowing from its suppliers at zero interest.
This is one of the most powerful patterns in retail. A business that grows while generating more cash per unit of growth — rather than requiring more cash — can self-fund its expansion without diluting shareholders or taking on debt. Both companies do this. Costco does it slightly more efficiently.
What this comparison teaches
The surface metrics — revenue, profit, margin — favor Walmart. Walmart's revenue is roughly four times Costco's. Walmart's gross margin is nearly double Costco's.
But the structural patterns — membership moat, inventory turnover loop, working capital advantage — tell a different story about durability and competitive position. This is why Costco has consistently traded at a higher price-to-earnings multiple than Walmart for the past two decades. The market is not paying for today's earnings. It is paying for the structural advantages that make tomorrow's earnings more probable.
The point of this comparison is not that Costco is better than Walmart. Both are extraordinary businesses. The point is that the same industry produces radically different financial shapes depending on strategic choices, and those shapes are visible to anyone who looks through all three lenses.
An agent will give you the numbers for both companies in seconds. Recognizing which numbers reveal the structural story, and which ones are surface-level, is the judgment this chapter is building.
8. Case study: stock compensation and the tech earnings illusion
The third case study addresses a pattern specific to the technology sector that affects how you read every tech company's financials.
Consider a hypothetical — though the numbers are representative of real large-cap technology companies. A company reports:
- Revenue: $25 billion
- Net income: $6 billion
- Operating cash flow: $9 billion
- Stock-based compensation: $4 billion
The income statement shows $6 billion in profit. The cash flow statement shows $9 billion in operating cash flow. An agent summarizing this company's financials will likely describe "strong cash generation" — operating cash flow exceeding net income, which under normal circumstances is a green signal.
But the $9 billion figure includes a $4 billion add-back for stock-based compensation. SBC is a non-cash expense — the company did not write a check to its employees; it gave them shares. Accounting rules require subtracting SBC from earnings (because it is a real cost to shareholders through dilution) but adding it back on the cash flow statement (because it did not involve cash).
The economic reality is somewhere between $6 billion and $9 billion. The company genuinely generated $9 billion in cash — the shares issued to employees did not require cash. But that cash generation came at the cost of diluting existing shareholders. If you value the company based on $9 billion in operating cash flow without adjusting for SBC, you are pretending the dilution does not exist.
How to adjust
The simplest adjustment: subtract SBC from operating cash flow to get "adjusted cash flow from operations." In this example, that is $9 billion minus $4 billion, or $5 billion. This gives you a more conservative — and more honest — view of the cash the business generates for existing shareholders.
Some analysts go further and compute a "SBC margin" — stock-based compensation as a percentage of revenue. In this example, 16%. For context, companies across the technology sector range from single-digit percentages (more mature, established companies) to 25% or higher (high-growth companies paying below-market salaries and compensating with equity).
The pattern to watch is the trend. SBC as a percentage of revenue declining over time suggests the company is transitioning to cash compensation as it matures, or that the stock price has risen enough that fewer shares are needed to deliver the same compensation value. SBC as a percentage of revenue rising — or staying flat while revenue grows — suggests structural reliance on equity compensation that will continue diluting shareholders.
Why this matters for agent-assisted analysis
This is one of the most common places where an agent's default analysis will mislead you.
Ask an agent to assess a technology company's financial health, and it will almost certainly report the operating cash flow figure without adjusting for SBC. The agent is not wrong — the reported number is correct under accounting rules. But it is incomplete, and the incompleteness systematically flatters technology companies.
When you use an agent to read technology company financials, adding the instruction "adjust operating cash flow for stock-based compensation and show both numbers" takes ten seconds and materially changes your view of the company. This is the kind of specific, targeted verification that Chapter 2's four-role framework is designed for — the agent reads; you know what adjustment to demand.
The trade-off in adjusting for SBC
There is a legitimate counterargument. If a company issues $4 billion in stock to employees who build products that generate $25 billion in revenue, the stock issuance is a productive investment — not waste. Subtracting SBC entirely from cash flow arguably penalizes companies for paying employees in the most tax-efficient way.
The honest answer is that neither the adjusted nor the unadjusted number is "correct." The adjusted number is more conservative and protects you from overvaluation. The unadjusted number is more optimistic and reflects the actual cash in the bank account. Sophisticated analysis uses both, along with a dilution analysis (how many shares are outstanding, how fast is the share count growing?) to form a complete picture.
The point is not to memorize one adjustment. It is to recognize that the default numbers an agent produces — the numbers that appear in headlines and summaries — have blind spots, and those blind spots systematically favor certain types of companies.
9. Using agents as readers — what to ask for and what to verify yourself
With the three lenses and the signal framework in place, here is how the division of labor works between you and an agent.
What agents do well
Data extraction. Pulling five years of financials, computing margins and ratios, flagging year-over-year changes — this is pure computation. An agent will do it faster and more accurately than you will in a spreadsheet. There is no judgment involved in calculating gross margin; there is only arithmetic.
Cross-company comparison. Normalizing financial data across two or three competitors — adjusting for different fiscal year endings, different accounting conventions, different reporting structures — is tedious work that agents handle reliably.
Footnote reading. 10-K footnotes can run fifty pages. An agent can scan them and surface the material disclosures — debt maturities, customer concentration, related-party transactions, contingent liabilities — that you would need hours to find manually.
Pattern flagging. An agent can identify that operating cash flow has been below net income for three consecutive years, or that goodwill has grown from 15% to 40% of total assets, or that the single largest customer now represents 30% of revenue. These are mechanical comparisons that become the starting point for your investigation.
What you must verify yourself
Whether the pattern matters. An agent flags that gross margin declined 2 percentage points. Is that competitive pressure (bad), a deliberate pricing decision (could be good), or a product mix shift (neutral)? The agent can suggest possibilities. Only you — armed with context about the industry, the company's stated strategy, and your investment thesis — can judge which explanation is most likely.
Whether the comparison is fair. An agent compares two companies' debt-to-equity ratios and reports that Company A is "more leveraged." But Company A might be in an industry where higher leverage is standard (banking, real estate), or the debt might be long-dated at low interest rates while Company B's debt matures next year. Ratios without context are noise.
Whether the narrative is consistent. This is the most important verification. The agent gives you three summaries — one for each lens. Do they tell a consistent story? If the income statement shows expanding margins, the balance sheet shows declining debt, and the cash flow statement shows growing free cash flow — the story is consistent. If the income statement shows expanding margins but operating cash flow is flat or declining — the story is inconsistent, and the inconsistency is where the real question lives.
Whether the agent is defaulting to consensus. As discussed in Chapter 1, agents default to consensus views. When an agent describes a company as "well-positioned for growth" or "facing competitive headwinds," ask: is this your analysis or a summary of what every analyst has already said? The question is not rhetorical. If the agent's output could have been produced by summarizing the first page of Google results, it has not added value — it has added confidence without adding information.
A practical validation protocol
Here is a five-step protocol for validating an agent's three-lens reading. This is not a recipe to follow mechanically. It is a framework to internalize over time.
Step 1 — Request structured output. Ask the agent for five years of financials with margins, ratios, and trends. Specify: gross margin, operating margin, operating cash flow vs. net income, free cash flow, debt-to-equity, and any customer concentration disclosures. If it is a technology company, ask for stock-based compensation as a percentage of revenue.
Step 2 — Read the trends before the numbers. Before looking at any specific number, look at the direction. Are things getting better or worse across all three lenses? If all three are improving, the story is straightforward. If they diverge, you have found the interesting question.
Step 3 — Identify the one thing that scares you most. Every company has something. A single customer that is too important. Debt that matures at a bad time. Margins that depend on a patent expiring. The question is not "does this company have risks?" — every company does. The question is "what is the one risk that, if it materialized, would change everything?" This is a judgment call that the agent cannot make for you.
Step 4 — Check the agent's strongest claim against the weakest lens. If the agent says "strong cash generation," check the balance sheet for debt increases that might be funding the cash position. If the agent says "durable moat," check the income statement for margin compression that might indicate the moat is eroding. Use the lenses against each other.
Step 5 — Ask: what would change my mind? If you are positively inclined toward the company, state the condition that would reverse your view. If you are negatively inclined, state the condition that would make you reconsider. Write it down. This connects to the thesis discipline in Chapter 7 — you are building the habit of falsifiable beliefs.
What Bloomberg still does that agents cannot
It is worth being honest about the limits of agent-assisted analysis using public data.
Bloomberg terminals — and institutional-grade tools like FactSet, Capital IQ, and Refinitiv — provide several things that are not available through public sources:
- Consensus estimates with granularity. Not just the consensus EPS, but the distribution of analyst estimates, which analysts revised recently and in which direction, and the historical accuracy of each analyst.
- Real-time institutional position changes. Who is buying, who is selling, and how quickly. By the time this appears in public 13-F filings, it is 45 days old.
- Alternative data feeds. Satellite imagery of retail parking lots, credit card transaction data, app download trends — data that supplements or contradicts the company's reported numbers.
- Speed. Bloomberg's news feed is faster than public media. In markets, information that is ten minutes old can be obsolete.
These advantages are real. They are why professional investors pay $24,000 per year per terminal. They are also why the framing of this curriculum is not "agents replace Bloomberg." The framing is: agents plus public data give you a training ground for building investment judgment. That training ground is more than sufficient for learning. For some investors and some strategies, it may also be sufficient for investing — but making that claim broadly would be dishonest.
What agents and public data are excellent for: learning to read financial statements, developing pattern recognition, practicing the three-lens framework, building the habit of verification, and training the judgment muscles that Chapter 3's first principles introduced. Think of it as a practice court versus the professional league. The skills transfer. The competitive environment does not.
10. Trade-off: what pattern recognition misses
Pattern recognition at the level this chapter teaches is shallow compared to deep sector expertise. This is not false modesty. It is a structural limitation worth understanding.
A generalist using the three-lens framework can catch obvious problems — persistent cash flow shortfalls, dangerous debt trajectories, related-party transactions, earnings that diverge from cash. These are cross-sector patterns that appear in the same shapes regardless of industry.
What the generalist misses:
Industry-specific accounting conventions. Banks report net interest income instead of revenue. Insurance companies have loss reserves that function differently from product warranties. Real estate investment trusts (REITs) use funds from operations (FFO) instead of net income. The three-lens framework still applies in principle, but the specific patterns change — and the generalist does not have the vocabulary to distinguish a normal industry-specific pattern from an abnormal one.
Cycle position. Cyclical industries — energy, mining, shipping, banking — look phenomenally healthy at the top of a cycle. Margins are high, cash flow is strong, debt is manageable relative to peak earnings. Then the cycle turns, and the same company's financials deteriorate rapidly. A generalist looking at pattern trends will see green signals at the exact moment the cycle is about to reverse. Experienced sector analysts know where they are in the cycle. Generalists usually do not.
Competitive dynamics that have not shown up in financials yet. A company's moat could be eroding in ways that take two to three years to appear in the income statement. A new competitor is gaining market share, but the incumbent's revenue is still growing because the market itself is expanding. The financial patterns look green. The competitive reality is yellow or red. Recognizing this requires industry knowledge, customer conversations, and competitive intelligence that no financial statement provides.
Management quality beyond the numbers. The three-lens framework assesses what management has produced. It does not assess whether management will continue to produce it. Capital allocation skill, strategic clarity, and intellectual honesty — what Buffett calls "honest and able management" — are visible over decades but not diagnosable from two years of financials.
None of this means the framework is useless. It means the framework has a known boundary. For a generalist investor — someone building judgment across sectors rather than specializing in one — the three-lens framework catches the majority of obvious problems and surfaces the majority of structural advantages. That is enough to avoid the worst mistakes and to ask the right follow-up questions.
The trap is mistaking the framework for deep expertise. If the three-lens reading looks clean and you proceed with confidence, you are assuming that the patterns visible to a generalist capture the full picture. Sometimes they do. Sometimes the thing that kills the investment was always outside the frame.
Knowing the frame's boundaries is itself a skill. Chapter 6 on risk management is partly about sizing positions in proportion to your confidence — which should be proportional to how well you understand the industry, not just the financials.
Workshop — Three-lens comparison
Time: 60–90 minutes. Tools: Any AI agent (Claude Code, Codex, Cursor). Output: A saved document comparing two companies, with a concluding judgment.
Instructions
Step 1 — Pick a public company. Use the same one from the Chapter 1 workshop if you did it. If not, pick a company whose product or service you personally use and understand. Not a company from the news. Not a company someone recommended. A company where you have genuine context as a customer or user.
Step 2 — Pick its closest public competitor. "Closest" means: same customers, same product category, overlapping market. If your company is Costco, the competitor is Walmart or BJ's. If your company is Netflix, the competitor is Disney+ or Warner Bros. Discovery. If your company is Salesforce, the competitor is HubSpot or Microsoft Dynamics.
Step 3 — Ask your agent to run the three-lens analysis for both companies. Use this request structure (adapt for your specific companies):
"Pull the last five years of financials for [Company A] and [Company B]. For each company, provide: (1) Gross margin, operating margin, and net margin trend. Revenue composition if available — recurring vs. one-time, geographic breakdown, customer concentration. (2) Debt-to-equity trend, total debt and maturity schedule if disclosed, goodwill as a percentage of total assets. (3) Operating cash flow vs. net income for each year, free cash flow, and working capital trend. If either is a technology company, also show stock-based compensation as a percentage of revenue. Flag any year where the three lenses tell inconsistent stories."
Step 4 — Read the output lens by lens, not company by company. Compare both companies' income statements first. Then both balance sheets. Then both cash flow statements. The contrast is more informative than reading each company in isolation.
Step 5 — Apply the signal framework. For each company, categorize each lens as green, yellow, or red. Note the specific patterns driving your categorization.
Step 6 — Answer three questions in writing.
One: Which company's financial shape scares you more, and why? Be specific — name the pattern, not a feeling.
Two: What is the single most important difference between these two companies that is not visible from the income statement alone? (This forces you to use the balance sheet and cash flow lenses.)
Three: If you had to own one of these two companies for ten years without the ability to sell, which would you choose? Defend in three sentences.
Step 7 — Save the document with both tickers and today's date. You will use it again in Chapter 5 (valuation) and Chapter 9 (capstone).
Why this workshop matters
The three-lens framework is abstract until you apply it. Two companies in the same industry make the patterns vivid — the structural choices become obvious in contrast.
The question "which scares you more?" is deliberately personal. Fear is a signal. If a specific pattern triggers unease, that unease likely points to a risk you would underweight in a formal analysis. Learning to name the source of your discomfort is a judgment skill.
The question "which would you own for ten years?" forces long-term thinking. Most financial analysis is implicitly about the next quarter or the next year. Compounding — the core mechanism of wealth creation through equities — operates over decades. The company with the better next quarter is not always the company with the better next decade. The three-lens framework is most powerful when applied to the question of structural durability, not short-term momentum.
The three financial statements are not a scorecard. They are three different windows into the same room. Through one, you see the business in motion — how it makes money, how efficiently, how predictably. Through another, you see the structure that holds it up — what it owns, what it owes, how fragile the foundation is. Through the third, you see the truth of it — whether the motion and the structure are producing real cash or elaborate accounting.
No single window shows the whole room. The discipline is standing at all three.
Chapter 5 turns the patterns you have learned to read into a valuation question: given what you now see, what is the company worth? The answer is always a story — and the story is always yours.