Valuation Is a Story Wrapped in Numbers
Chapter 5 of 10 in the AI-Native Investor curriculum.
In January 2014, Aswath Damodaran — a professor at NYU Stern who has valued more public companies than arguably anyone alive — published his valuation of Uber. He estimated the company was worth roughly $5.9 billion. A few months later, venture capitalist Bill Gurley published a rebuttal arguing the company was worth far more, perhaps $25 billion or higher. Both used discounted cash flow models. Both had access to the same public information about Uber's business. Both were financially literate far beyond the median investor.
The difference was not arithmetic. Both could discount cash flows correctly. The difference was the story each man told about what Uber would become. Damodaran saw a car service competing with taxis and limos — a large but bounded market. Gurley saw a platform that would replace car ownership for urban populations — an essentially unbounded market. The revenue growth rate, the terminal market share, the margin structure at maturity — every number in each model followed logically from the story the analyst chose to believe.
The numbers did not resolve the disagreement. They could not. The numbers were the disagreement, translated into a format that made it look like a math problem.
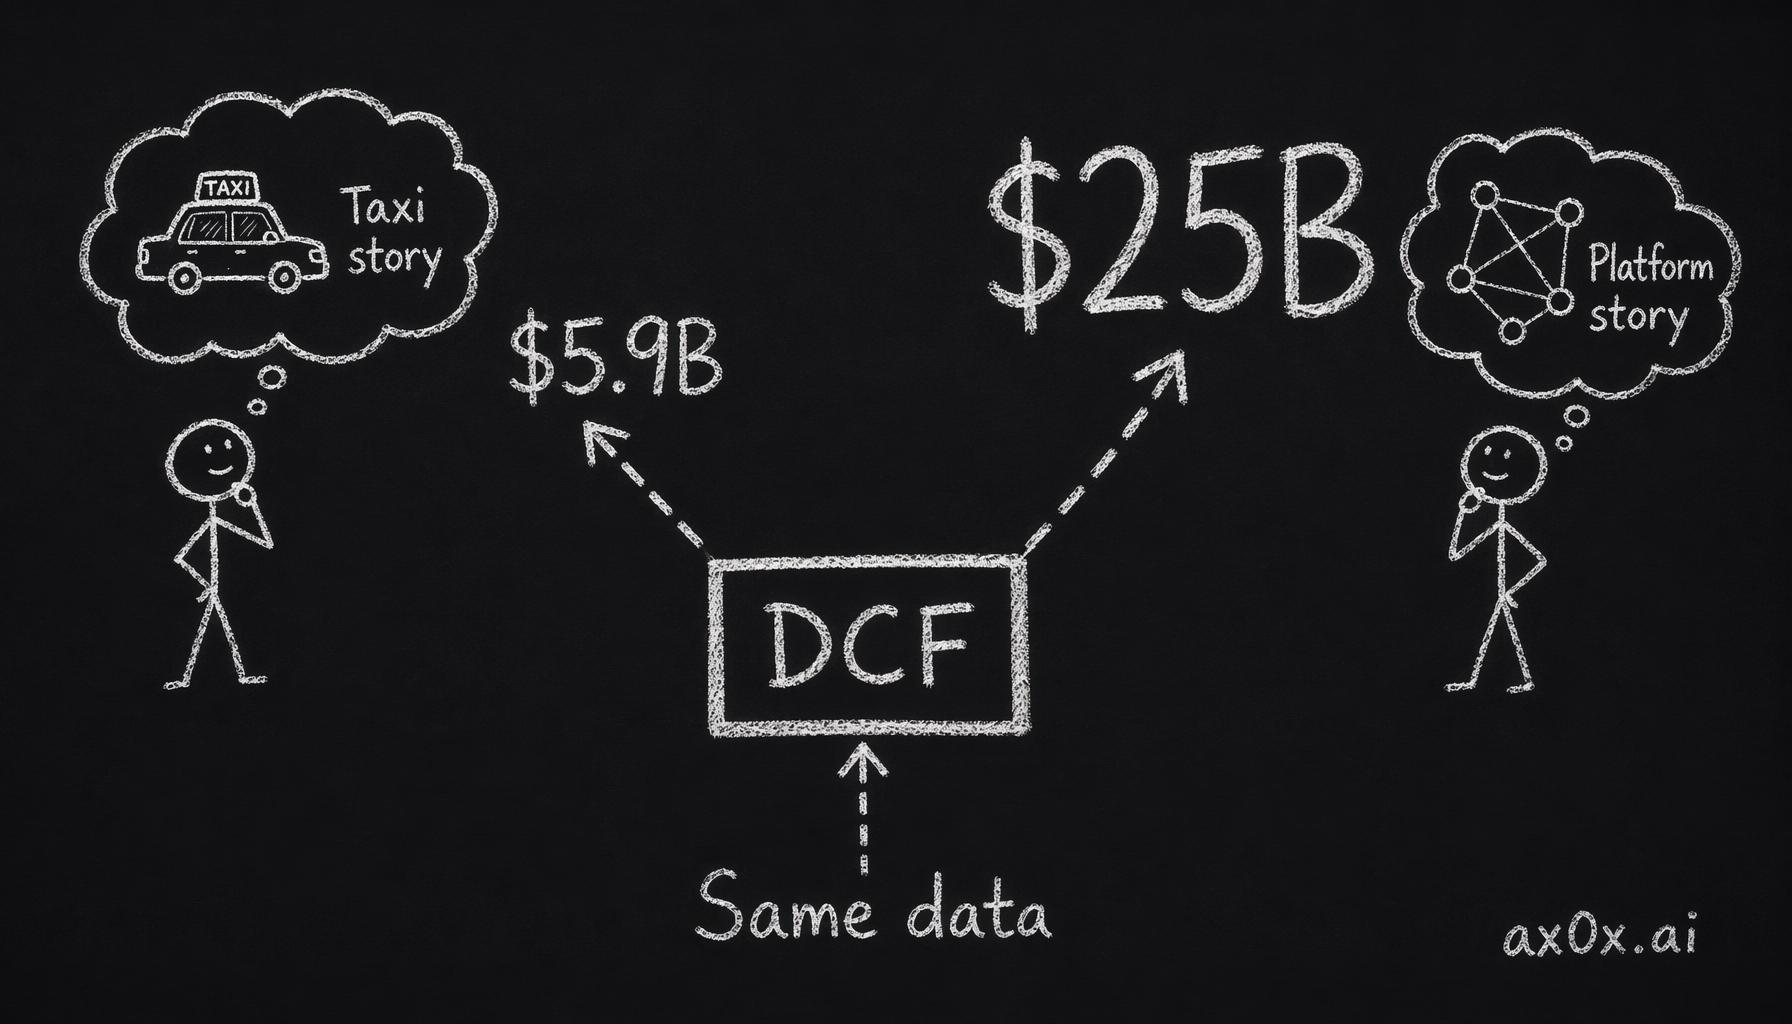 One DCF, one dataset — a different story about Uber turns the same model into wildly different values.
This is the central insight of this chapter, and of Damodaran's life work: valuation is not a calculation. It is a narrative expressed in numbers. Every input to a valuation model is a story choice — a bet on what the future looks like. Agents can compute the model flawlessly. What they cannot do is choose the story. That is your job.
What this chapter covers
- Why valuation is a narrative problem, not a math problem
- Three approaches to valuation — and when each one lies to you
- DCF: a story told in five assumptions
- Sensitivity analysis — finding the assumption you are actually betting on
- Multiples: reference points that pretend to be answers
- The agent-human split: who computes and who narrates
- Four ways agent-generated valuations go wrong
- When narrative becomes rationalization
- Workshop: change one assumption, watch the story shift
1. Why valuation is a narrative problem, not a math problem
Most people encounter valuation as a formula. Price-to-earnings ratio. Enterprise value divided by EBITDA. Discounted cash flow. The formula takes inputs, produces a number, and the number tells you whether the stock is cheap or expensive. This framing is appealing because it makes investing look like engineering — get the formula right, plug in accurate data, and the answer falls out.
It is also wrong, in a way that matters.
The formula is real. The math works. The problem is upstream of the math: every input to the formula is a judgment call about the future, and the future is not a dataset. Revenue growth next year is not a fact you can look up. It is a belief about customer behavior, competitive dynamics, macroeconomic conditions, and management execution — compressed into a single percentage. The discount rate is not a physical constant. It is a belief about how risky the cash flows are, which is itself a belief about how volatile the business is, which is itself a belief about the industry, the management team, the regulatory environment, and a dozen other things you cannot measure precisely.
Damodaran puts it bluntly: every number in a valuation is a story in disguise. The revenue growth rate is a story about demand. The operating margin is a story about competitive advantage. The reinvestment rate is a story about how much the company needs to spend to sustain that advantage. The discount rate is a story about how confident you are in all the other stories.
This is not a flaw in the method. It is the method. Valuation does not eliminate uncertainty — it organizes it. A good valuation does not tell you what a company is worth. It tells you what you have to believe for the company to be worth a given price. That is a profoundly different thing.
When someone says "my DCF shows the stock is worth $150," the useful question is not "is $150 right?" The useful question is: "what story does $150 require, and do I believe that story?"
Why this matters for working with agents
An agent asked to "value this company" will produce a DCF. The DCF will have inputs. The inputs will be reasonable — typically consensus estimates pulled from analyst reports or implied by recent financial data. The math will be correct. The output will look authoritative.
The output will also be consensus dressed as original analysis. The agent did not choose the story. It defaulted to the story that most analysts already tell about the company. If you accept the agent's valuation without examining the story underneath, you are not making an investment decision. You are outsourcing your judgment to the average of Wall Street's opinions, laundered through a model that makes it feel like your own analysis.
The skill this chapter teaches is reading the story inside the numbers — so that when an agent hands you a valuation, you can identify which assumptions matter, which ones you disagree with, and what the valuation looks like under your story instead of the consensus story.
2. Three approaches to valuation — and when each one lies to you
There are three fundamental approaches to valuing a company. Every technique you will encounter — every ratio, every model, every back-of-the-envelope calculation — is a variation on one of these three.
Intrinsic valuation (discounted cash flow)
The logic: a business is worth the present value of all the cash it will generate in the future. Estimate the cash flows, estimate the risk, discount back to today. The answer is the intrinsic value.
When it works best: Companies with predictable cash flows, stable businesses, situations where you have a defensible view of the future. Coca-Cola in 1990. A toll road with a 50-year concession. A mature SaaS company with 95% net revenue retention.
When it lies to you: Companies where the future is genuinely unknowable. Early-stage companies with no earnings and no clear path to profitability. Companies in the middle of a structural disruption where the range of outcomes is enormous. A DCF for a pre-revenue biotech company is not a valuation — it is a fiction with a discount rate attached.
The specific lie: A DCF produces a single number with decimal precision. That precision is false. The output is exactly as uncertain as the inputs, but it does not look uncertain. A DCF that says $147.32 is not more precise than one that says "somewhere between $100 and $200." It just feels more precise, and that feeling is dangerous.
Relative valuation (multiples)
The logic: if similar companies trade at 15 times earnings, this company should too. Compare the company's multiple to its peers, to its own history, or to the sector average. If the multiple is lower, the stock is cheaper. If higher, more expensive.
When it works best: Mature industries with many comparable companies. Banking. Retail. Utilities. Situations where the business models are similar enough that a ratio comparison is meaningful.
When it lies to you: When the "comparable" companies are not actually comparable. Comparing Tesla to Ford on a P/E basis in 2021 was technically possible but analytically useless — the two companies had fundamentally different growth profiles, margin structures, and capital requirements. The multiple comparison assumed they were the same kind of business. They were not.
The specific lie: Multiples make valuation look objective by anchoring to market prices. But market prices already reflect the market's story. If the entire sector is overvalued, comparing your company to sector peers will make it look fairly valued — relative to an inflated baseline. Multiples tell you what the market thinks. They do not tell you what the company is worth.
Asset-based valuation
The logic: a company is worth what its assets would sell for, minus what it owes.
When it works best: Companies being liquidated. Holding companies. Real estate investment trusts. Any situation where the value is in the assets, not in the operating business.
When it lies to you: Any company where the value is primarily in future earnings rather than current assets. Valuing Google by its asset base would dramatically understate its value because most of Google's value comes from a business model that does not sit on the balance sheet as a tangible asset.
The specific lie: Asset-based valuation treats the company as a pile of things, not as a going concern. For most operating businesses, this misses the point entirely.
The trade-off across all three
No single approach is correct for every situation, and each approach has failure modes that the others catch. A DCF for a company with unpredictable cash flows is unreliable — but checking it against multiples can bound the range. A multiple comparison that looks cheap might reflect a genuine problem that a DCF would surface through declining cash flow projections. The discipline is using multiple approaches and paying attention to where they disagree, because the disagreement points you toward the assumptions that matter most.
3. DCF: a story told in five assumptions
A discounted cash flow model has many inputs, but only five that carry almost all of the weight. Everything else — tax rates, working capital changes, depreciation schedules — matters at the margin but rarely swings the valuation by more than 10-15%. The five that matter are the five story choices.
Story choice 1: Revenue growth
How fast will the company grow, and for how long?
This is the most visible assumption and usually the most debated. It is also where the biggest valuation swings come from for growth companies. A company growing revenue at 30% annually for the next five years will be worth dramatically more than one growing at 15%, even if everything else is identical.
The story underneath the number: what is the total addressable market? How much of it can this company realistically capture? What does the competitive landscape look like in three years? In five? Is the growth rate sustainable, or is it pulling forward future demand?
When Damodaran valued Uber in 2014, he estimated the total addressable market for car services at roughly $100 billion globally. Gurley argued the addressable market was not "car services" but "transportation" — a market measured in trillions. Same company. Same financial data. Completely different stories about what market the company operated in. The revenue growth assumption that followed from each story was the single largest driver of the valuation gap.
Where the assumption hides risk: High growth rates compound. A small error in the growth assumption early in the projection period cascades through every subsequent year. If you are wrong about year-one growth by five percentage points, you are wrong about year-five cumulative revenue by 20-30%, depending on the trajectory. Growth assumptions deserve the most scrutiny precisely because they carry the most leverage.
Story choice 2: Operating margins at maturity
What will the company earn on each dollar of revenue once it is done investing in growth?
This is the assumption that separates companies that create value from companies that just get big. Revenue without margin is activity, not business. Amazon traded at seemingly absurd valuations for years because the market's story was: margins are low now because the company is investing in growth, but at maturity, the margins will be substantial. That story turned out to be correct — for Amazon. It was not correct for many other high-growth companies that invested heavily and never found the margin.
The story underneath the number: what is the company's competitive advantage, and how durable is it? Companies with pricing power — luxury brands, dominant platforms, businesses with switching costs — can sustain higher margins. Companies competing primarily on price — commodity producers, retailers, undifferentiated service providers — face constant margin pressure from competitors.
Where the assumption hides risk: The margin assumption often does the quiet heavy lifting in a DCF while the revenue growth assumption gets all the attention. A company growing at 25% annually with 10% operating margins at maturity is worth much less than the same growth rate with 25% margins. But margin assumptions are harder to scrutinize because they require understanding the company's cost structure, competitive position, and industry dynamics in detail. They reward the financial statement literacy from Chapter 4.
Story choice 3: Reinvestment requirements
How much does the company need to invest to sustain its growth?
Some businesses are capital-light: they grow revenue without proportional increases in assets. Software companies, consulting firms, asset-light platforms. Others are capital-heavy: every dollar of revenue growth requires significant investment in factories, equipment, infrastructure, or inventory. Airlines, semiconductor manufacturers, logistics companies.
The story underneath the number: is this a business that throws off cash as it grows, or one that consumes cash to grow? The reinvestment rate determines how much of the earnings are available to shareholders versus how much gets plowed back into the business. A company with high growth and high reinvestment requirements might grow impressively and still generate modest free cash flow.
Where the assumption hides risk: Reinvestment rates tend to be stable for mature businesses but highly uncertain for growing ones. A company might claim it can grow with minimal capital investment, but if the growth requires acquisitions, increased marketing spend, or infrastructure buildout, the actual reinvestment will be much higher than the model assumes. The gap between what management says about capital requirements and what the financial statements show is one of the patterns from Chapter 4 that directly feeds into this assumption.
Story choice 4: The discount rate
How risky are these cash flows?
The discount rate is the interest rate used to convert future cash flows into present value. A higher discount rate means future cash flows are worth less today — it reflects the idea that riskier cash flows should be valued less, because there is a greater chance they will not materialize.
In academic finance, the discount rate is calculated using the capital asset pricing model (CAPM) or its variants, which estimate risk based on historical stock price volatility relative to the market. In practice, the discount rate is a summary judgment about how uncertain the entire story is.
The story underneath the number: how confident are you that the growth, margin, and reinvestment assumptions will play out? A stable utility with decades of predictable earnings deserves a lower discount rate than a high-growth tech company entering a new market. But "how risky" is itself a story — two reasonable people can look at the same company and disagree on the discount rate by two or three percentage points, which translates to a 20-40% difference in the final valuation.
Where the assumption hides risk: The discount rate is where people bury disagreements they do not want to examine. If your DCF produces a valuation that is too low, you can "fix" it by lowering the discount rate — arguing that the company is less risky than the market thinks. If it is too high, raise the discount rate. This is backwards reasoning: choosing the discount rate to produce the valuation you want rather than estimating it honestly and accepting the number that falls out. Damodaran calls this "the fudge factor" and warns that it is the most common form of valuation manipulation.
Story choice 5: Terminal value
What happens after the explicit forecast period ends?
Every DCF model projects cash flows for a specific period — usually five to ten years — and then estimates a "terminal value" for everything after that. The terminal value often represents 60-80% of the total valuation. Read that again. The majority of the valuation comes from a single assumption about what happens after the period you can forecast with any specificity.
The story underneath the number: what kind of company is this at maturity? Does it grow at the rate of the broad economy forever? Does it slowly decline? Does it maintain competitive advantages indefinitely?
Where the assumption hides risk: The terminal value is where intellectual laziness concentrates. The analyst spends hours on the first five years of projections and then casually assumes a terminal growth rate of 2-3% (roughly GDP growth) and a stable margin profile, and that single assumption drives most of the valuation. If the terminal growth rate is wrong by one percentage point, the valuation can shift by 15-25%. The terminal value is often the most important number in the model and the one that receives the least scrutiny.
The five assumptions as a system
These five choices are not independent. They interact. A story about high revenue growth usually implies higher reinvestment requirements. A story about high margins at maturity usually implies a durable competitive advantage, which implies a lower discount rate. A story about a massive terminal value usually implies the growth story plays out successfully.
When you change one assumption, the others should change too — but they often do not, because the analyst changes the assumption they are focused on and forgets to update the others. This is how internally inconsistent valuations get built: the growth rate tells one story, the margins tell another, and the terminal value tells a third. The model still produces a number. The number is meaningless.
Consistency across the five assumptions is what separates a valuation that means something from a spreadsheet exercise. The narrative has to cohere. A company cannot simultaneously grow at 30% annually, require minimal reinvestment, earn software-like margins, carry low risk, and sustain this indefinitely. Each of those claims has implications for the others, and a good valuation traces the connections.
4. Sensitivity analysis — finding the assumption you are actually betting on
A DCF produces a single number: the company is worth $X. That number is the output of five story choices, each of which could be wrong. Sensitivity analysis answers the question: which of those story choices is the valuation actually betting on?
The technique is simple. Take your base-case valuation. Change one assumption by a meaningful amount — revenue growth from 20% to 15%, or the operating margin from 25% to 20%, or the discount rate from 10% to 12%. Hold everything else constant. Watch how the valuation changes.
The assumption that moves the valuation the most is the assumption you are betting on. It is the load-bearing wall of your story. If you are wrong about that specific assumption, the rest of the model does not save you.
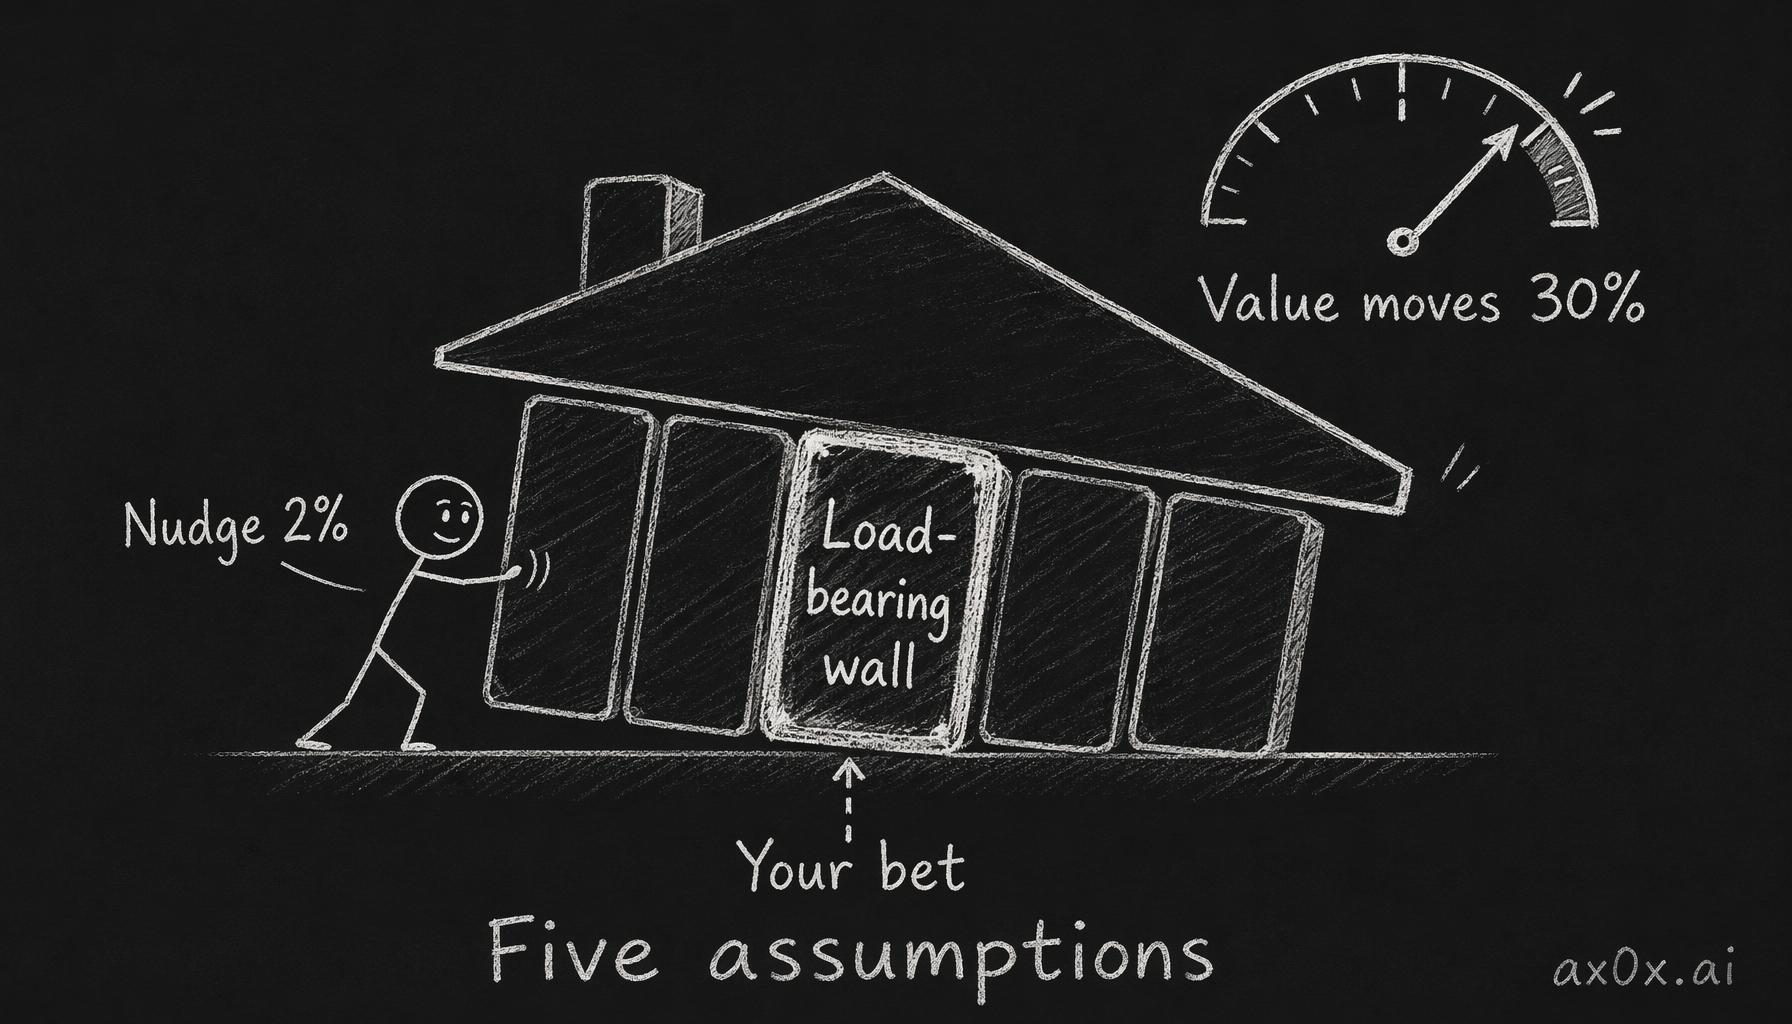 Among five assumptions one is load-bearing — nudge it and the valuation swings 30%; that wall is what you're actually betting on.
What sensitivity analysis reveals
For most growth companies, the valuation is most sensitive to revenue growth and terminal value — and since terminal value is partly a function of revenue growth, the two are entangled. If you are buying a growth stock, you are primarily betting that the growth will materialize. The margin assumptions, the discount rate, the reinvestment rate — they all matter, but they matter less. The growth story is the story.
For most mature companies, the valuation is most sensitive to the margin assumption and the discount rate. Growth is modest and predictable, so small changes do not move the needle much. But a two-percentage-point change in operating margins at a company doing $50 billion in revenue is a billion dollars of earnings, and that flows directly to the valuation.
For highly leveraged companies — those with a lot of debt — the valuation is most sensitive to the discount rate and the ability to service that debt. The equity value is what is left after debt is paid, so small changes in the company's cost of capital or cash flow stability can make the equity worth a lot or worth nothing.
The one-variable question
After running the sensitivity analysis, force yourself to answer: "If I could only be right about one assumption, which one would I choose?"
That is the assumption your investment thesis needs to defend. If you cannot defend it — with evidence, not just optimism — the thesis is weak, regardless of how reasonable the other four assumptions look.
This is also the question you should direct your agent to help you answer, rather than asking the agent to "value the company." The agent's default valuation uses consensus assumptions. Your sensitivity analysis identifies which assumption matters most. Your thesis is your argument for why that assumption should be different from consensus. The valuation falls out of the thesis — not the other way around.
The limits of sensitivity analysis
Sensitivity analysis tests one variable at a time while holding others constant. Real-world changes rarely work this way. A recession does not lower revenue growth while leaving margins untouched — it compresses both simultaneously. A competitive disruption does not just reduce growth — it often increases the discount rate too, because the business becomes riskier.
Scenario analysis — testing multiple assumptions changing together — is more realistic but also more complex. The number of possible combinations grows quickly, and the temptation is to test only the scenarios you find plausible, which means the analysis confirms your existing beliefs rather than challenging them.
The honest approach is to do both: sensitivity analysis to identify which single variable matters most, and then two or three full scenarios (best case, base case, worst case) that change multiple variables together in internally consistent ways. If your worst-case scenario still produces a valuation above the current stock price, you have a margin of safety — a concept Graham introduced and Buffett considers the most important idea in investing. If your base case requires every assumption to be right for the valuation to justify the current price, you have no margin of safety, and you are speculating on precision.
5. Multiples: reference points that pretend to be answers
If DCF is a story told in five assumptions, a multiple is a one-sentence summary of someone else's story — with the plot omitted.
When you say "this stock trades at 25 times earnings," you are saying: the market is willing to pay $25 for each dollar of annual earnings this company produces. That 25x carries inside it every story choice that a DCF would make explicit — growth expectations, margin trajectory, risk assessment, reinvestment requirements, terminal value. All of it compressed into a single ratio.
This compression is the appeal and the danger. Multiples are fast. They are comparable. They fit in a headline. They also strip out all the information you actually need to make a judgment.
The four multiples that matter most
Price-to-Earnings (P/E). The most commonly cited and the most commonly misused. It divides the stock price by earnings per share. A stock with a P/E of 15 is "cheaper" than one with a P/E of 30, all else being equal. But all else is never equal. The P/E ratio says nothing about growth rates, nothing about margin sustainability, nothing about capital structure. Two companies with the same P/E can have wildly different futures. One might be a stable business trading at a fair price. The other might be a declining business whose earnings are about to fall off a cliff, making the seemingly low P/E a trap.
Enterprise Value to EBITDA (EV/EBITDA). Compares the total value of the business (equity plus debt, minus cash) to its earnings before interest, taxes, depreciation, and amortization. More useful than P/E for comparing companies with different capital structures because it strips out the effects of debt and tax differences. But EBITDA ignores real expenses — depreciation represents actual wear on assets, and companies with high capital expenditure needs (airlines, manufacturers, telecoms) look artificially profitable on an EBITDA basis.
Price-to-Free-Cash-Flow (P/FCF). Divides the stock price by free cash flow per share. Free cash flow is what the business actually generates after all expenses and investments — it is the cash available to shareholders. More grounded in economic reality than P/E or EV/EBITDA, but more volatile year to year because capital expenditures can be lumpy. A company building a new factory this year will have depressed free cash flow that does not represent its ongoing earning power.
Price-to-Sales (P/S). Divides the stock price by revenue per share. Used primarily for companies that do not have positive earnings — pre-profit growth companies, turnarounds, early-stage businesses. The advantage is that revenue is harder to manipulate than earnings. The disadvantage is that revenue without profitability is not inherently valuable. A company doing $10 billion in revenue and losing money on every dollar is not worth more than a company doing $2 billion profitably, despite what the revenue number suggests.
What multiples actually tell you
A multiple is not a valuation. It is a data point. It tells you what the market currently believes about the company's future, compressed into a ratio. The useful questions are comparative:
Why does Company A trade at 30x earnings while Company B in the same industry trades at 15x? The difference implies the market expects Company A to grow faster, earn higher margins, or both. Is that expectation justified? That question sends you back to the financial statement analysis from Chapter 4 and the five story choices from the DCF framework.
Why does this company's multiple today differ from its own multiple five years ago? The change implies the market's story about the company has shifted. What changed? Revenue growth slowed? Margins compressed? Competition intensified? A new market opportunity emerged? The multiple is the symptom. The story is the cause.
Why does this sector's average multiple differ from the overall market's? Sector-level multiple differences reflect structural differences in growth, capital intensity, cyclicality, and risk. Technology companies trade at higher multiples than utilities because their growth profiles justify it — usually. When the sector multiple expands beyond what growth alone can justify, you are looking at either a genuine paradigm shift or a bubble. Telling the two apart is the hardest problem in investing and one where historical examples are your best teacher.
The trap of relative valuation
Here is where multiples lie to you most dangerously.
In 1999, Cisco traded at roughly 120 times earnings. Analysts argued it was reasonably valued because its peers — Intel, Microsoft, Oracle — also traded at high multiples. Cisco was "cheap" relative to other tech stocks. On an absolute basis, the valuation required Cisco to grow earnings at 25-30% annually for a decade, which would have made it one of the largest companies in the world by earnings. That did not happen. The stock fell over 80% and did not recover to its 1999 price for over two decades.
The relative comparison — Cisco is cheap compared to its peers — was technically accurate. But the peers were all overvalued, so being "cheap relative to expensive" did not provide margin of safety. It provided the illusion of rigor.
This is the fundamental limitation of multiples: they anchor you to market prices, and market prices already embed the market's consensus story. If the consensus story is wrong — if the entire sector is overvalued or undervalued — multiples will not warn you. They will confirm the consensus.
The defense against this trap is using multiples as one input alongside intrinsic valuation, not as a replacement for it. A stock that looks cheap on a P/E basis and also looks cheap on a DCF basis under conservative assumptions is more likely to be genuinely undervalued than one that only looks cheap relative to peers.
6. The agent-human split: who computes and who narrates
The division of labor between you and an agent in valuation work mirrors the PM-analyst structure from Chapter 1, but the specifics matter. Valuation is where the split is sharpest and where the risk of abdication is highest.
What agents do well in valuation
Computation. An agent can build a DCF model from public financial data in seconds. Revenue projections, margin assumptions, reinvestment rates, discount rates, terminal value — the mathematical scaffolding is straightforward, and agents execute it without errors. The formulas are unambiguous. The arithmetic is exact.
Data retrieval. Pulling historical financial data, consensus estimates, comparable company multiples, sector averages — this is pure lookup work that agents do faster and more comprehensively than any human. An agent can compile ten years of financial history for a company and its five closest competitors in the time it takes you to open a browser.
Scenario mechanics. Once you specify scenarios — "show me the valuation if growth is 15% instead of 25%, and margins are 18% instead of 22%" — the agent can compute every permutation instantly. The computational work of sensitivity analysis is trivially easy for an agent.
Presentation. Agents produce clean, well-organized output. The valuation will be formatted, the assumptions will be labeled, the sensitivity tables will be readable. This is useful because it reduces friction — you can spend your time thinking about the assumptions instead of wrestling with formatting.
What agents do poorly in valuation
Narrative selection. When an agent builds a DCF, it needs to choose the five story assumptions. It has no conviction. It has no view on the future. It defaults to consensus: analyst estimates for revenue growth, historical averages for margins, textbook formulas for discount rates. The output looks like original analysis. It is median-of-Wall-Street dressed up as research.
This is not a bug. It is a structural limitation. An agent does not have a thesis about NVIDIA's competitive position in the AI chip market in 2028. It has a summary of what analysts have written about NVIDIA's competitive position. Those are different things. The analyst opinions are already priced into the stock. If the agent's valuation confirms the current price, it has told you nothing.
Assumption consistency. An agent will use whatever inputs you or the consensus provide without checking whether they tell a coherent story. If you ask for 30% revenue growth with 5% reinvestment rates, the agent will compute the DCF without objecting — even though that combination implies the company can grow enormously while investing almost nothing, which is implausible for most businesses. Checking internal consistency requires business understanding, not calculation.
Judgment under uncertainty. The hardest moment in valuation is when the range of reasonable outcomes is wide. Is this company worth $80 or $200? A DCF can produce either number with defensible assumptions. The question of which assumptions to believe is a judgment call that depends on your understanding of the business, the industry, the competitive dynamics, and the macro environment. Agents can present both cases. They cannot tell you which one to believe.
The correct workflow
The agent computes. You narrate. The specific workflow:
 The split that works: separate story choices from technical inputs — the human narrates, the agent computes.
Step 1: Ask the agent to build a DCF with its default assumptions and to list every assumption explicitly. Do not accept a valuation without seeing the assumptions underneath it.
Step 2: Read the assumptions as a story. Not as numbers — as a narrative. "This model assumes the company will grow revenue at 18% annually for five years, reach 22% operating margins at maturity, reinvest 30% of operating income, face a 10% cost of capital, and then grow at 3% forever." Does that story make sense? Is it the story you would tell about this company?
Step 3: Identify the assumptions you disagree with. You do not need to disagree with all of them. Often one or two are the ones that matter. The sensitivity analysis from Section 4 tells you which ones to focus on.
Step 4: Change the assumptions you disagree with to reflect your story. Ask the agent to recompute. Compare the two valuations — the consensus story and your story. The gap between them is the gap between the market's view and yours.
Step 5: Ask yourself whether you have evidence for your story that the market does not have, or whether you are interpreting publicly available evidence differently. The first is an informational edge (rare and usually illegal for material nonpublic information). The second is an analytical edge (rare but legitimate). If the answer is neither — if you just like your story better — you probably do not have an edge, and the market price is more likely to be right than your alternative story.
This is honest and uncomfortable. But honest and uncomfortable is better than confident and wrong.
7. Four ways agent-generated valuations go wrong
Every failure mode below is a version of the same root problem: the agent computes correctly but narrates by default, and the default narrative is consensus.
Failure mode 1: Consensus assumptions as original thought
The agent pulls revenue growth estimates from analyst consensus. It pulls margin expectations from the same source. It uses a textbook WACC (weighted average cost of capital) formula for the discount rate. The output is, in effect, the average of what Wall Street analysts already believe — reformatted and presented as if it were independently derived.
The tell: the agent's valuation closely matches the current stock price. This is not a coincidence. The current stock price already reflects consensus estimates. If the valuation confirms the price, the model has circular logic — it used the inputs that produced the price to verify the price.
What to do about it: When the agent's valuation lands within 10-15% of the current stock price, treat it as confirmation that you understand the consensus view, not as validation that the stock is fairly valued. The question becomes: where do you disagree with consensus, and what does the valuation look like under your assumptions?
Failure mode 2: Terminal value hand-waving
The terminal value — the estimate of what the company is worth after the explicit forecast period — often constitutes 60-80% of the total DCF valuation. The agent typically calculates it using a perpetuity growth formula with a 2-3% terminal growth rate, which implies the company will grow roughly at the rate of the economy forever.
This is a reasonable default for mature, stable businesses. It is deeply misleading for businesses with structural advantages (which should grow above GDP indefinitely) or businesses facing disruption (which may not exist in their current form in fifteen years).
The tell: the terminal value dwarfs the projected cash flows from the explicit forecast period. This means the valuation is primarily a bet on what happens after your forecast ends — the period you can say the least about.
What to do about it: Ask the agent to show you the valuation with and without the terminal value. If removing the terminal value cuts the valuation by 70%, the model is telling you that most of the value comes from distant, uncertain cash flows. This does not mean the valuation is wrong — most of any company's value does come from the distant future. But it means your confidence in the terminal assumptions should be proportional to their weight, and most people are not nearly critical enough of a number that drives the majority of the result.
Failure mode 3: Discount rate blindness
The discount rate is where the agent's default behavior is most dangerous. Agents typically compute the discount rate using the capital asset pricing model, which estimates risk based on historical stock price volatility (beta) relative to the market. This is the textbook approach, and it is the approach most likely to produce a number that is wrong in an unexamined way.
The problem: beta measures how much a stock's price has moved relative to the market in the past. It does not measure how risky the business is going forward. A company can have a low beta because its stock has been stable for five years — and be on the verge of a disruption that will make it extremely risky. Conversely, a company with a high beta because of recent price volatility might actually be a stable business that the market temporarily mispriced.
Damodaran uses a memorable framing: beta measures price risk, not business risk. They are related but not identical, and the gap between them is where bad valuations hide.
The tell: the agent produces a discount rate between 8% and 12% for virtually every company, because that is where CAPM outputs land for most publicly traded stocks. If the discount rate looks the same for a utility company and a pre-profit biotech company, something is wrong. The risk profiles of those two businesses are vastly different, and the discount rate should reflect that difference.
What to do about it: After the agent computes the CAPM-based discount rate, ask yourself: does this number feel right? Not in a vague sense — in a specific sense. Would you lend this company money at this rate? If the discount rate is 9% and you would not lend the company money at 9% because you think there is a meaningful chance they cannot pay you back, the discount rate is too low. Your willingness to lend at a given rate is a gut check on the model's risk assessment, and when the gut check and the model disagree, investigate.
Failure mode 4: Growth extrapolation
Agents default to projecting recent trends forward. If a company has grown revenue at 25% annually for the last three years, the agent's base case will often project 20-25% growth for the next three to five years — gradually declining but starting from the recent level.
This is reasonable for some companies and catastrophically wrong for others. Growth rates mean-revert. A company growing at 25% is usually in the early or mid-stages of exploiting a market opportunity. The growth rate almost always declines as the company gets larger, the market matures, and competitors respond. The question is how fast the decline happens and where it stabilizes.
The tell: the agent projects growth rates that would, if sustained, result in the company capturing an implausible share of its total addressable market. If the agent's five-year projection implies the company will have 60% market share in an industry that has historically never seen a player above 30%, the growth assumption is incompatible with the market's structure.
What to do about it: Ask the agent to compute what revenue the growth assumptions imply in year five and year ten. Then compare that implied revenue to the total addressable market. If the implied market share is above 30-40% in a fragmented industry, the growth assumption is too aggressive — not because high growth is impossible, but because the assumption does not account for the competitive dynamics that limit market share in practice.
8. When narrative becomes rationalization
Everything in this chapter has argued that narrative is essential to valuation — that the numbers without a story are meaningless. This is true. It is also dangerous, because the same narrative flexibility that makes valuation useful also makes it the perfect vehicle for self-deception.
The human capacity for motivated reasoning is vast and operates below conscious awareness. When you own a stock and the price drops, your brain does not naturally say "perhaps my thesis was wrong." It says "the market is wrong and I should buy more." The narrative framework makes this easier, not harder: you can always construct a story that justifies the position you want to hold. Revenue growth is slower than expected? "The market opportunity is larger than analysts realize; growth will accelerate in the second half." Margins are compressing? "This is a deliberate investment phase; margins will expand when the investment matures." The stock has fallen 40%? "The market is overreacting to short-term noise; the long-term thesis is intact."
Each of these statements can be true. Each of them can also be a rationalization. The difference between a thoughtful narrative revision and a rationalization is evidence — and the willingness to confront evidence that contradicts your preferred story.
Three guardrails against narrative abuse
Guardrail 1: Pre-commitment. Before you build the valuation, write down what story you believe about the company, including specific predictions that would prove the story wrong. "If revenue growth falls below 15% for two consecutive quarters, my growth story is wrong." "If operating margins have not expanded by year three, the margin story is wrong." These are the kill criteria from Chapter 7. The key is writing them before you have a financial stake in the answer.
Guardrail 2: Inversion. After building the bull-case valuation, build the bear case with equal effort. Not a perfunctory "well, the economy could slow down" bear case — a serious, detailed bear case that uses the same analytical framework with different assumptions. If you cannot build a credible bear case, either you do not understand the risks or you are not trying. Both are problems.
An agent is useful here, but with a caveat. Ask it to play the short-seller: "give me the three strongest arguments that this company is overvalued." The agent will generate the arguments. But agent-generated bear cases tend to be generic — "competition could intensify," "growth could slow," "the economy could weaken." Push for specificity. "Which competitor, with what product, targeting which customers?" "What would cause growth to slow — market saturation, pricing pressure, or customer churn?" Specificity is where real bear cases live, and generic concerns are not bear cases, they are throat-clearing.
Guardrail 3: The outsider test. Show your valuation to someone who has no stake in the outcome. Not the thesis — the assumptions. Ask them: "do these assumptions seem reasonable?" The assumptions that make you defensive when questioned are usually the ones most contaminated by motivated reasoning. The defensive reaction is the signal. If you can discuss every assumption with equanimity, you are probably being honest. If one assumption makes you want to explain at length why it is correct, examine that one closely.
The Damodaran principle
Damodaran, who has published more valuations of public companies than perhaps anyone, updates his valuations regularly — and sometimes dramatically. When the story changes, the valuation changes. He does not hold onto a story that reality has contradicted.
This sounds easy and is not. Changing your story means admitting you were wrong, and admitting you were wrong about an investment you own means accepting a loss — of money, of self-regard, or both. The discipline of narrative-driven valuation is not just the ability to tell a good story. It is the willingness to abandon a story when the evidence turns against it.
Buffett says that the most important quality in an investor is temperament, not intellect. Temperament in this context means the ability to hold your thesis when the market disagrees and the thesis is right — and to abandon your thesis when the market disagrees and the thesis is wrong. Telling the two apart is the hardest problem in investing, and no valuation model will solve it for you. The model is a tool for organizing your thinking. The thinking is yours.
What Bloomberg has that agents do not
It would be dishonest to leave this chapter without acknowledging the institutional advantages that remain.
Bloomberg terminals — and the institutional infrastructure they represent — provide real-time data feeds, proprietary analyst models, counterparty information, and institutional-quality execution. A Bloomberg user can see real-time option pricing, institutional order flow, credit default swap spreads, and dozens of other signals that are not available through public data sources. These signals feed directly into valuation — a CDS spread widening on a company you are analyzing tells you something about the market's perception of credit risk that no public financial statement can.
Agents working with public data cannot replicate this. They can pull financial statements, compute ratios, and run models — but they are working with a subset of the information that institutional investors use. This does not make agent-assisted analysis useless. It means the analysis operates within a boundary. For learning to invest, for training your judgment, for building a research framework — public data is more than sufficient. For competing head-to-head with institutional desks on short-term information advantages — it is not.
The honest framing: agent-assisted valuation using public data is a training ground. It builds real analytical muscle. It does not provide the data advantages that institutions have. The edge you are building is not informational — it is analytical and behavioral. You are learning to ask better questions, construct better narratives, and maintain better discipline. Those skills compound over decades and are not dependent on having the fastest data feed.
Workshop — Change one assumption, watch the story shift
Time: 60–90 minutes. Tools: Any AI agent (Claude Code, Codex, Cursor). Output: A saved document comparing two valuations of the same company.
Instructions
Step 1 — Choose a company. Ideally the same one from the Chapter 1 workshop, so your analysis builds on what you have already done. If you chose a different company in the Chapter 4 workshop, either works.
Step 2 — Ask your agent for a default DCF. Use language like: "Build a discounted cash flow valuation for [company]. Use consensus estimates where available. List every assumption explicitly — revenue growth rate for each year, operating margin at maturity, reinvestment rate, discount rate (WACC), and terminal growth rate. Show the math, but also state each assumption as a sentence about the future."
The second part is critical. You want to see both the number and the story. "Revenue growth of 18% in year one" is a number. "Revenue will grow at 18% in year one because the company's core product is still under-penetrated in three major markets" is a story. The story is what you will evaluate.
Step 3 — Read the assumptions as a narrative. Do not look at the final valuation number yet. Read the five story choices. For each one, ask: "Do I believe this? Why or why not?" Mark each assumption with one of three labels:
- Accept — the assumption matches your understanding of the company
- Question — you are unsure and would want to investigate further
- Disagree — you have a specific reason to believe the assumption is wrong
Step 4 — Run a sensitivity analysis. Ask the agent: "Which single assumption is this valuation most sensitive to? Show me the valuation if that assumption is 25% higher and 25% lower than the base case." Observe the range. The width of that range is a measure of how much uncertainty is hiding in the model.
Step 5 — Change one assumption. Pick the assumption you marked "Disagree" — or, if you did not disagree with any, pick the one labeled "Question" that the sensitivity analysis showed matters most. Change it to reflect your view. Ask the agent to recompute the DCF with your revised assumption, holding everything else constant.
Step 6 — Compare the two valuations. The agent's default (consensus story) and your revision (your story). Write three sentences:
- What the consensus story assumes about this company's future.
- What your story assumes differently, and why.
- What evidence would change your mind — what you would need to see to go back to the consensus assumption.
Step 7 — Save the document with the company ticker, today's date, and the label "Ch5-valuation." You will use it in the Chapter 7 workshop when you formalize your thesis.
Why this matters
The point of this exercise is not to produce a "correct" valuation. There is no correct valuation for a company whose future is uncertain — which is all of them. The point is to experience, concretely, how sensitive a valuation is to the story choices underneath it. To feel the gap between the decimal-point precision of the output and the broad uncertainty of the inputs.
After this exercise, you should not be able to see a valuation number without immediately wondering: what story does that number require? If you have that reflex, the chapter worked.
The number and the story
Every valuation is two things at once: a mathematical statement about present value and a narrative claim about the future. The math is the easy part — agents handle it flawlessly. The narrative is the hard part, and it is where every valuation succeeds or fails.
Agents will produce valuations that look precise and feel authoritative. The numbers will be internally consistent. The formatting will be clean. And underneath the clean formatting, every number is a story choice that the agent did not make — it borrowed from consensus.
Your job is the story. Not a story you want to believe. The story the evidence supports, tested against the strongest version of the opposing story, held accountable by kill criteria you wrote before you had money at stake.
The scarcest skill in valuation is not computation. It is the honesty to tell a story you might not like — and the discipline to change the story when reality contradicts it.
Chapter 6 asks the question that follows from any valuation: how much can you afford to be wrong? Risk is not volatility. It is the probability of a loss you cannot recover from.